
 Home
Home News
News
- 1 XRP price is trading above the key moving averages showcasing bullishness on the daily timeframe.
- 2 The bulls looked aggressive in the previous trading sessions.
- 3 The price trades in the bullish zone, heading upward by making a higher structure.
XRP price is trading above the key moving averages showcasing the bullishness in the price on the daily technical chart. The price rose by almost 20% in the whole month suggesting bulls were dominating in recent sessions.
XRP crypto has seen a rise of approximately 3.55% over the past week, and this growth has increased to around 20.77% over the past month. However, over the past three months, XRP crypto dropped by about 5.13%, while the crypto has gained around 20.24% over the last six months. XRP’s performance throughout the year has been volatile, with a slump of approximately 1.30% year-to-date.
At press time, the XRP crypto price was $0.61474, with an intraday gain of 3.81%, showing bullishness on the charts. Moreover, the trading volume is $4.32 Billion while the market cap is $33.19 Billion. Moreover, analysts have maintained a strong buy rating.
Technical Analysis of XRP Crypto Price in 1-D Timeframe
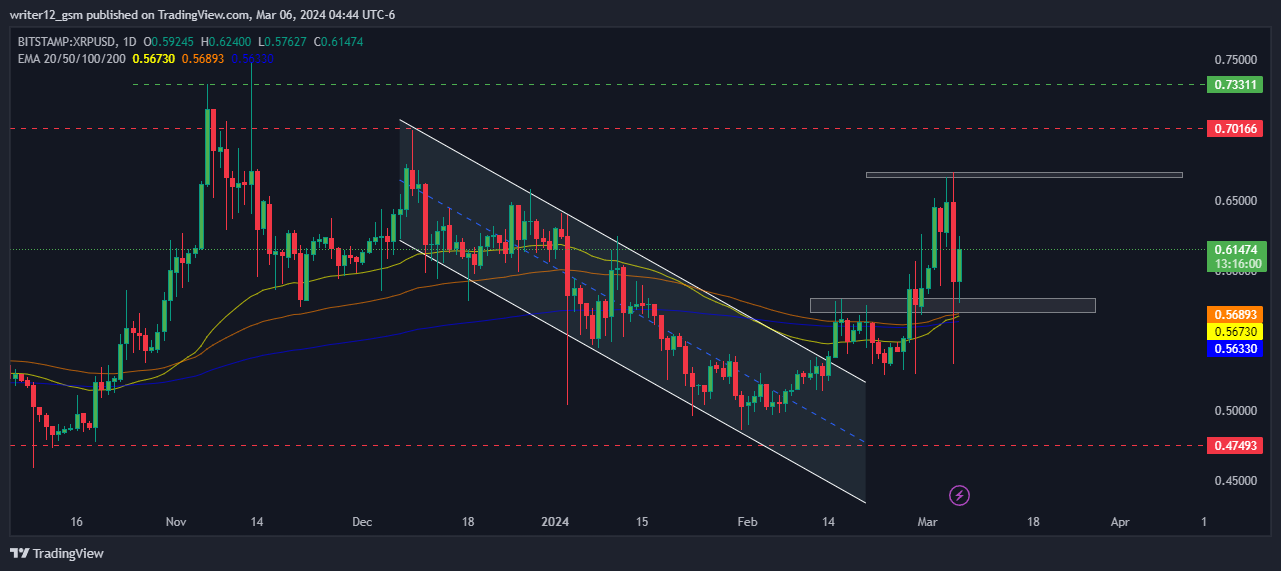
XRP (USD: XRP) has seen its crypto price rise steadily for the past sessions, gaining 22% last month. If it can keep this level, the XRP price could continue to go up and reach the first and second targets of $0.65000 and $0.70166. However, if the XRP price cannot maintain this level and falls, then it might hit the closest support levels of $0.56730 and $0.47493.
At the time of publishing, XRP crypto (USD: XRP) is trading below the 50 and 200-Day SMAs (Simple moving averages), which are supporting the price trend. The current value of RSI is 58.22 points. The 14 SMA is above the median line at 59.82 points which indicates that the XRP crypto is bullish.
The MACD line at 0.02132 and the signal line at 0.01640 are above the zero line. A bullish crossover is observed in the MACD indicator which signals more bullishness for the XRP crypto price.
Moreover, as per the trading view indicator summary out of 26 indicators, 1 is on the selling side, 9 are on the neutral side and 16 are on the buying side. The indicators summary of the trading view is dominating on the buying side.
Summary
XRP (USD: XRP) technical oscillators also support the bullish trend. The MACD, RSI, and EMA are highlighting bullish indications and suggest that the positive trend may continue in the XRP crypto price. However, if buying volume adds up then the price might touch the upper levels by making a higher high structure. Hence, XRP price is expected to move upward giving bullish views over the daily time frame chart.
Technical Levels
Support Levels: $0.56730 and $0.47493
Resistance Levels: $0.65000 and $0.70166
Disclaimer
This article is for informational purposes only and does not provide any financial, investment, or other advice. The author or any people mentioned in this article are not responsible for any financial loss that may occur from investing in or trading. Please do your own research before making any financial decisions.

Andrew is a blockchain developer who developed his interest in cryptocurrencies while pursuing his post-graduation major in blockchain development. He is a keen observer of details and shares his passion for writing, along with coding. His backend knowledge about blockchain helps him give a unique perspective to his writing skills, and a reliable craft at explaining the concepts such as blockchain programming, languages and token minting. He also frequently shares technical details and performance indicators of ICOs and IDOs.


