
 Home
Home News
News

- 1 The ATOM coin price showcased a breakout and depicted bullishness.
- 2 Bulls are looking aggressive and targeting the $15 mark.
The Cosmos (ATOM) coin price replicated a sharp comeback and decisively surpassed the neckline hurdle of $12. Moreover, the coin has picked momentum, and an intense surge of over 12% in the intraday session was noted, revealing investor interest. Furthermore, the volatility rate increased from 0.029 to 0.055, with a spike in trading volume signifying the sharp jump of the coin.

The Cosmos coin (ATOM) price has delivered a rounding bottom formation breakout and climbed above the $12 mark. Moreover, the trend is intact, and the coin will replicate a follow-on bullish marubozu candlestick and may catch the $15 mark soon. Furthermore, the technicals are glimpsing the long buildup activity. However, the coin has yet to cross the high of $ 14.30 to signal a reliable breakout, or else profit booking may be seen soon.

The Cosmos coin (ATOM) price was $13.80 at press time, with an intraday gain of 10.59%, showing a breakout on the charts. Moreover, the trading volume has increased by 14.90% to $604.97 Million. The ATOM coin has a weekly return ratio of 16.73% and 20.46% on a monthly basis. The pair of ATOM/BTC is at 0.000207 BTC, and the market cap is $4.54 Billion. Analysts are bullish and suggest that the ATOM coin will continue to soar in gains and may reach $20 soon.
Cosmos Witnessed V-Shaped Reversal: Can ATOM Reach $20 Mark?
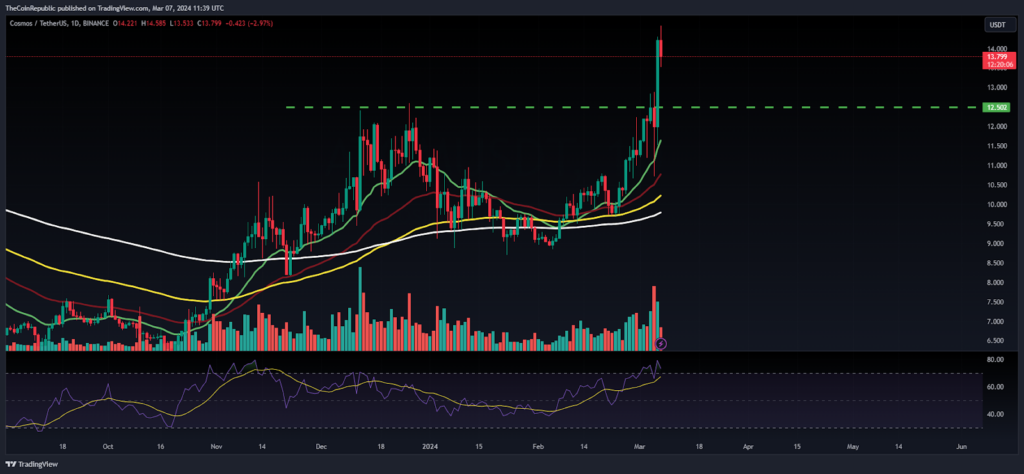
The ATOM coin depicted a V-shaped recovery from the support zone of $9 and glimpsed a breakout in the daily charts. Moreover, the technicals are signaling the bullish cues and are suggesting that the up move will continue and ATOM will retest $15, followed by the $18 mark soon. The Open Interest (OI) increased by 2% to $160.26 Million, revealing the long buildup.
The Relative Strength Index (RSI) curve stayed in the overought zone and formed a positive crossover, exhibiting bullish momentum. Similarly, the MACD indicator showcased a bullish crossover and replicated the green bars on the histogram, suggesting the outperformance for the upcoming sessions.
Cosmos Depicted Trendline Breakout; Is the Bullish Trend Ahead?
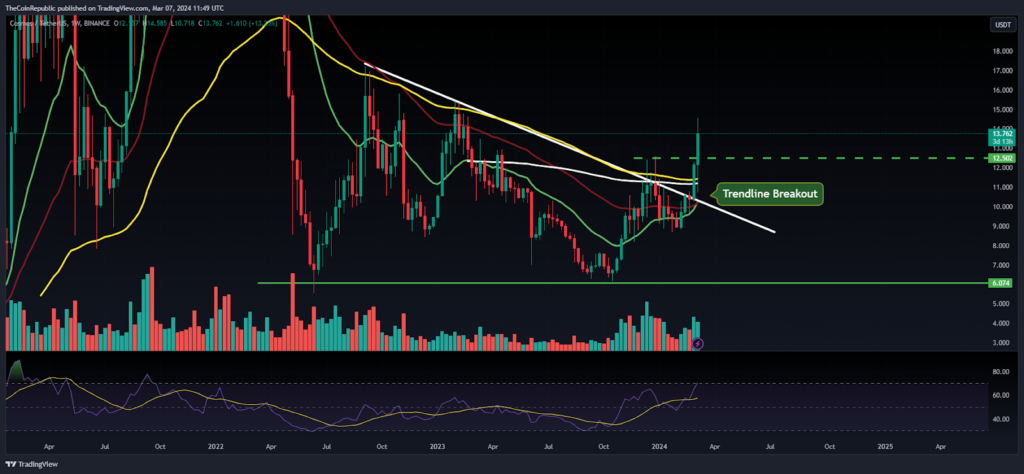
The coin has given a falling trendline breakout on the weekly charts, and a massive run of over 30% in the last two trading sessions was noted. The price action showcased a golden crossover, and buyers are looking aggressive and are eyeing to surpass the $15 mark. The coin may stretch the bull move to retest the supply region of $20 in the upcoming sessions.
Summary
The Cosmos coin (ATOM) has given a sharp spike and enlisted a breakout above the $12 mark, revealing the bullish momentum. Moreover, the coin has picked traction and is ready to retest the $20 mark in the following sessions.
Technical Levels
Support Levels: $12 and $10
Resistance Levels: $15 and $18
Disclaimer
The views and opinions stated by the author or any other person named in this article are for informational purposes only and do not constitute financial, investment, or other advice.
Steve Anderson is an Australian crypto enthusiast. He is a specialist in management and trading for over 5 years. Steve has worked as a crypto trader, he loves learning about decentralisation, understanding the true potential of the blockchain.


