
 Home
Home News
News
- 1 Hedera crypto has been on a winning streak for the last five weeks and has added 95% to its market cap.
- 2 At press time, HBAR crypto was trading at $0.130 recording a swift intraday loss of 0.58%.
The Hedera crypto extended its rally and has added nearly 17% this week by Friday. The crypto has surged significantly in the last couple of sessions, recovering the losses incurred in the earlier sessions of the week. The altcoin is set to close the week in green thus resuming its winning streak.
However, on Friday, the crypto traded lightly as the volume inflow was low. Hbar price seems to be stabilizing at the higher levels after adding nearly 20% in the last couple of sessions. The bulls re-established their dominance after losing in the earlier sessions of the week.
Moreover, the price noted a breakout from a parallel channel pattern formed near the swing high. The bears tried to push the price lower and attempted a breakdown of the lower boundary of the channel on Thursday. However, the bulls made a comeback near the 20-Day EMA as the price bounced back.
Currently, the bears seem to be struggling to regain control of the trend. The bulls are at the driving seat due to which the price may continue to project an upward trajectory and conquer higher supply levels.
HBAR Price Rise Is Supported By Significant Surge In Volume!
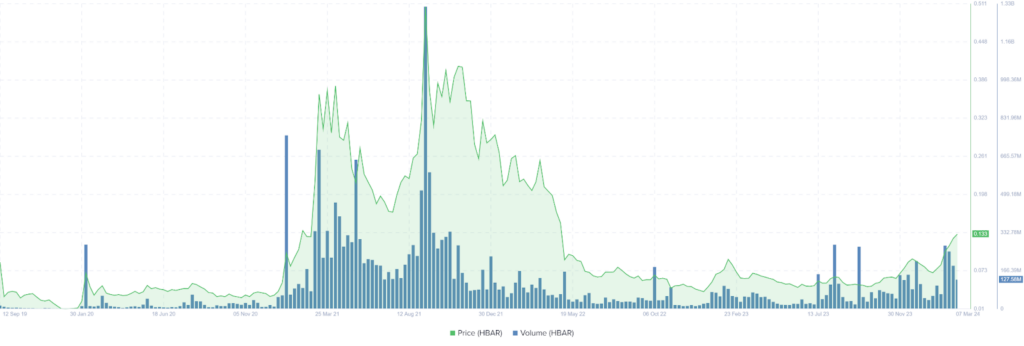
Moreover, the Hedera crypto noted a significant and continuous rise in the volume inflow in the last few weeks along with the price rise. The average volume has risen from $93 Million in December to the current volume inflow of nearly $270 Million volume.
The intraday volume received was at $117.71 Million with a drop of nearly 50.7% as compared to the previous day. Also, the live market capitalization of HBAR crypto was $4.471 Billion and it ranks 31st in the overall crypto market.
Volatility Remains Steady Despite The Price Surge!
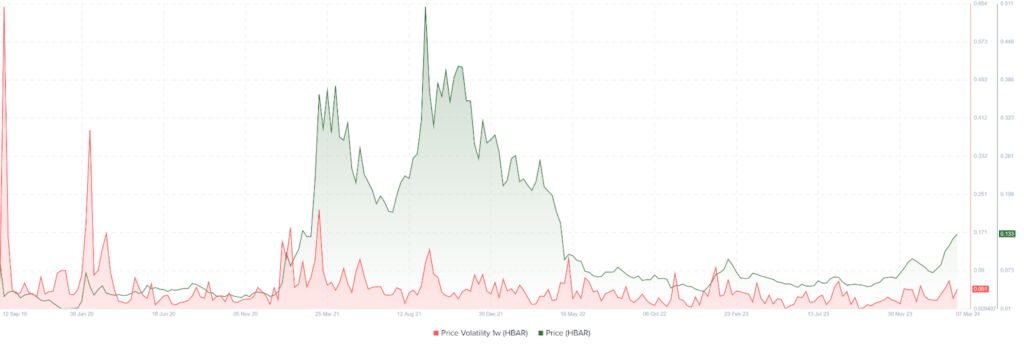
The volatility chart demonstrates the possible fluctuations in the price. As observed on the above chart, the HBAR crypto has been in an upward trajectory in the last few months. However, there has been less development in the volatility chart.
The volatility seems to be constant despite the rise in volume highlighting the stability in the price at the higher levels.
Social Dominance Is Rising In HBAR Crypto!
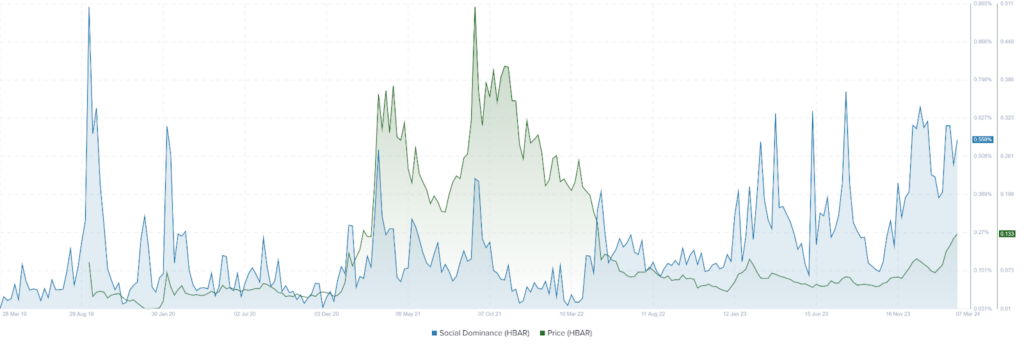
The social dominance sentiment is an indicator of the increasing or decreasing acceptance of HBAR crypto among the users. The social dominance chart displays a positive trajectory over the period.
Looking precisely, the crypto saw a significant rise after November 2023 and is still rising indicating the rising interest of the users about the HBAR crypto in the short term.
The increasing social dominance may also have a positive impact on the hedera price as the increasing participation of users may create more demand and help the crypto price rise.
Development Activity In Hedera Crypto?
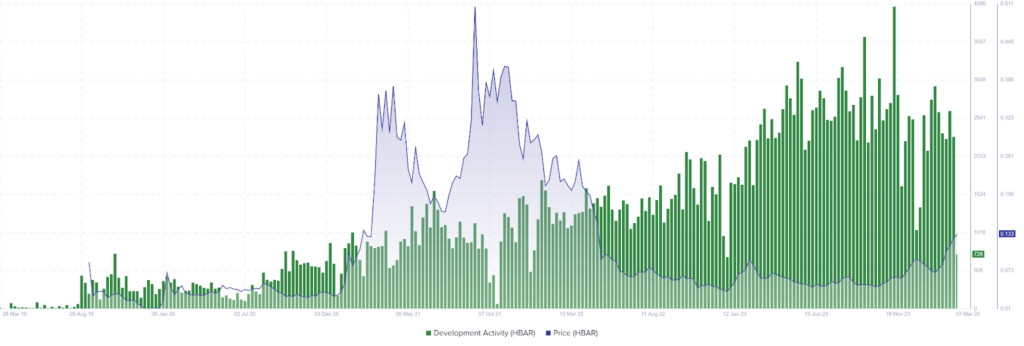
Furthermore, the development activity reflects the level of activity in the form of undergoing projects and developments in the crypto. The developer’s activity shows that it is on the rise.
Hedera Price Indicator Analysis
The technical indicators imply a positive outlook as per the EMA Analysis. The Hedera price trades higher above the key exponential moving average of 20, 50 and 200-Days EMAs, suggesting a positive outlook in the short term as well as in the long term.
At the time of writing, the RSI line was hovering near 73.61 points and that of the SMA line was at 68.10 points indicating a positive trend prevailing. Moreover, a bullish crossover of both the lines was observed indicating the continuation of a bullish trend in the near term.
Hedera Price Trend Analysis
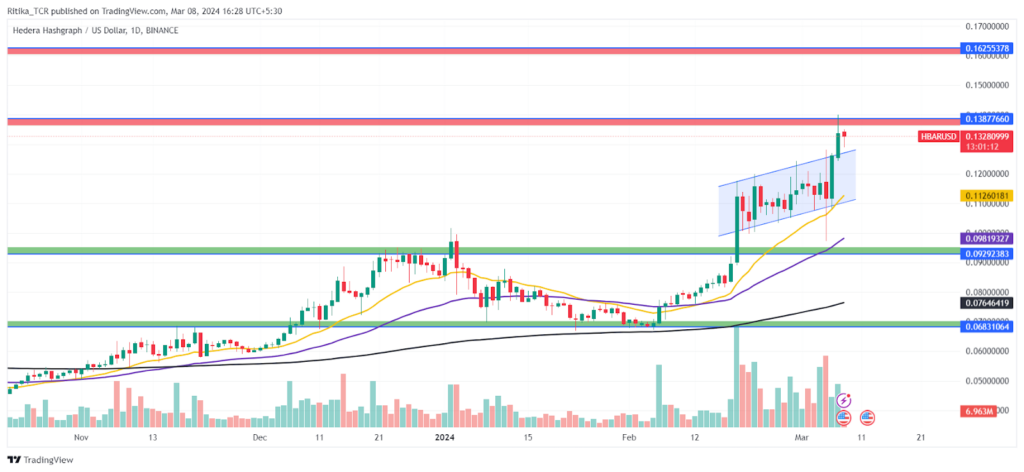
The short-term trend outlook lies on the bullish side as HBAR cryptocurrency gained significantly and is projecting a positive trajectory in the short term. The bulls are in control of the trend and might continue to pump the price to higher levels.
On the higher side, the price has more room to surge till the next supply zone of $0.16 level if the bulls surpass the $0.138 level. It indicates an upside potential of nearly 21% by the end of March 2024.
The bearish view of analysts hopes the price to break below the 20-Day EMA after which it may drop to the lower demand levels of $0.11 and $0.10.
Conclusion
Hedera Crypto has been in a bullish trend after breaking out of a short-term correction phase in February 2024. The price rise is supported by the key exponential moving averages which are acting as dynamic support levels. The price rise is supported by the significant rise in the volumes.
Also, the volatility is low which shows the price stabilizing at the current levels. The social dominance saw a significant surge in recent months highlighting the increasing acceptance of the Hedera crypto. The development activity is high which reflects potential.
Technical level
- Support Levels: $0.138 and $0.161
- Resistance Levels: $0.108 and $0.092
Disclaimer
The views and opinions stated by the author, or any people named in this article, are for informational purposes only and do not establish financial, investment, or other advice. Investing in or trading crypto or stock comes with a risk of financial loss.

Amanda Shinoy is one of the few women in the space invested knee-deep in crypto. An advocate for increasing the presence of women in crypto, she is known for her accurate technical analysis and price prediction of cryptocurrencies. Readers are often waiting for her opinion about the next rally. She is a finance expert with an MBA in finance. Quitting a corporate job at a leading financial institution, she now engages herself full-time into financial education for the general public.


