
 Home
Home News
News

- 1 The OP token price persisted in surge and is heading toward the $5 mark.
- 2 A rising wedge pattern was depicted which conveys the bullish sentiments.
The Optimism (OP) token price persists in extending upward movements and displays an uptrend on the charts. The token has been delivering buying momentum since the start of 2024, lifting the gains beyond the sellers’ eyesight.

The HashKey exchange has listed the Optimism (OP) token on March 7 at 8.00 UTC. This recent development boosted positive sentiments and lifted the OP token price beyond the $4 mark.

At press time, the OP token price trades at $4.61 with an intraday gain of 0.15%, indicating neutral behaviour on the charts. The OP token has a monthly return ratio of 38.25% and 106.10% on a yearly basis. The pair of OP/BTC is at 0.0000684 BTC, and the market cap is $988.40 Million. Analysts are bullish and suggest that the OP token price may reach $10 soon.
Volatility and Weighted Sentiment Analysis
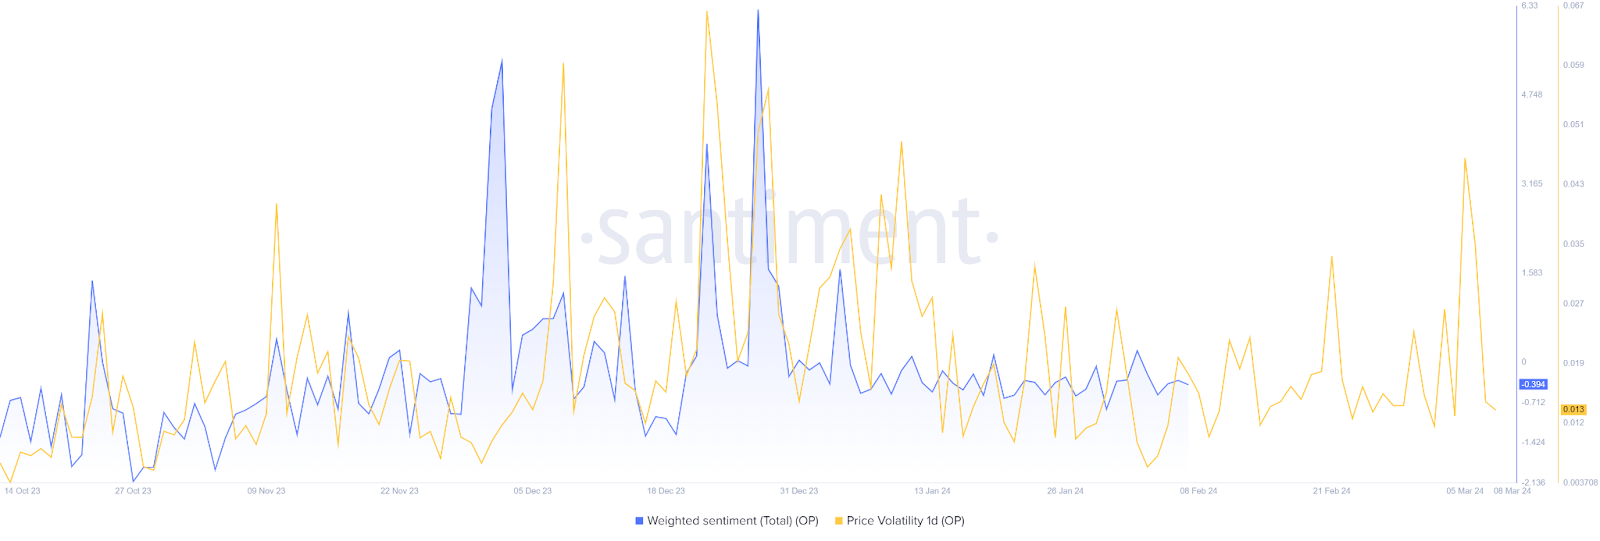
As per the data from Santiment, the weighted sentiment noted a drop similar to the price volatility data, which signifies the negative sentiments for the token. The volatility rate reduced from 0.048 to 0.013 in the last 48 hrs, indicating the stable move of the token. However, the token replicates a pump by the investors but is due to the market surge. The (FUD) in crypto terms, signifies Fear, Uncertainty, and Doubt, which delivers a neutral outlook for the token.
Optimism Price Volume Outlook on Daily TimeFrame
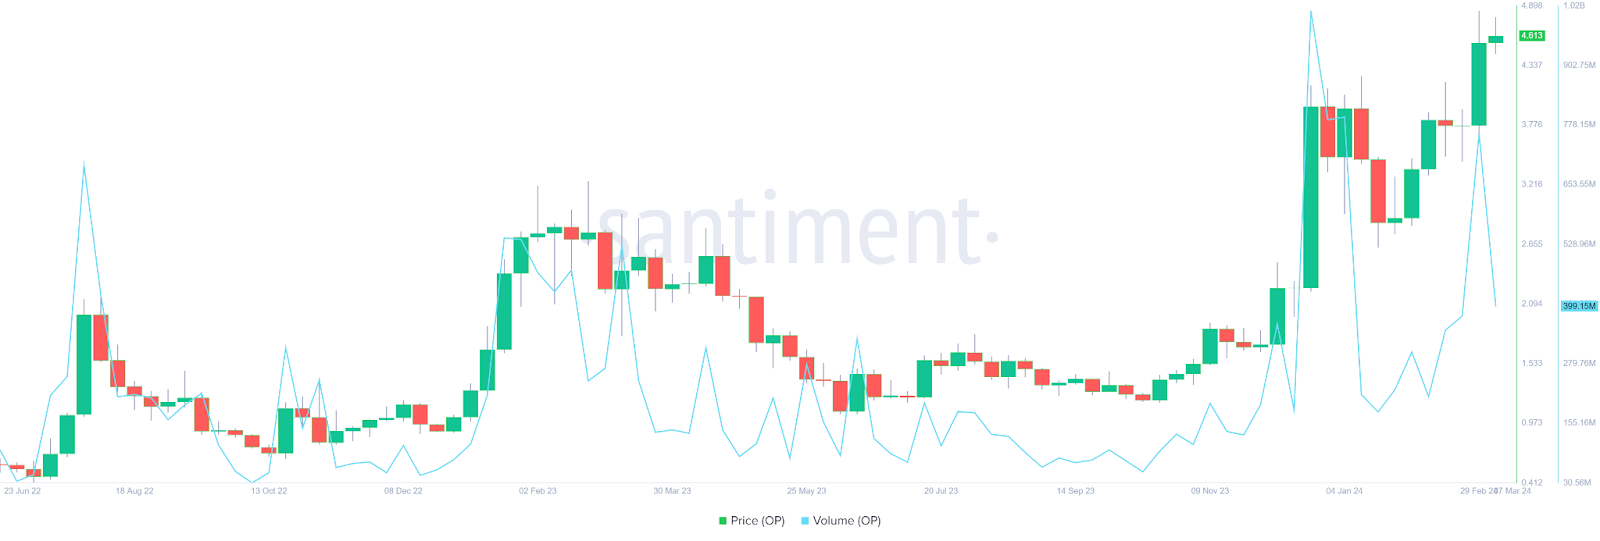
Following the crypto market surge, the OP token price continued gaining momentum, and a rise was witnessed in the past sessions. However, the trading volume replicates pump and dump by the investors. This week, the volume dropped by over 38% to $368.10 Million, which signifies seller engagement. However, the token price sustained the gains near the upper trendline mark of $4.80.
OP Price Vs Social Dominance
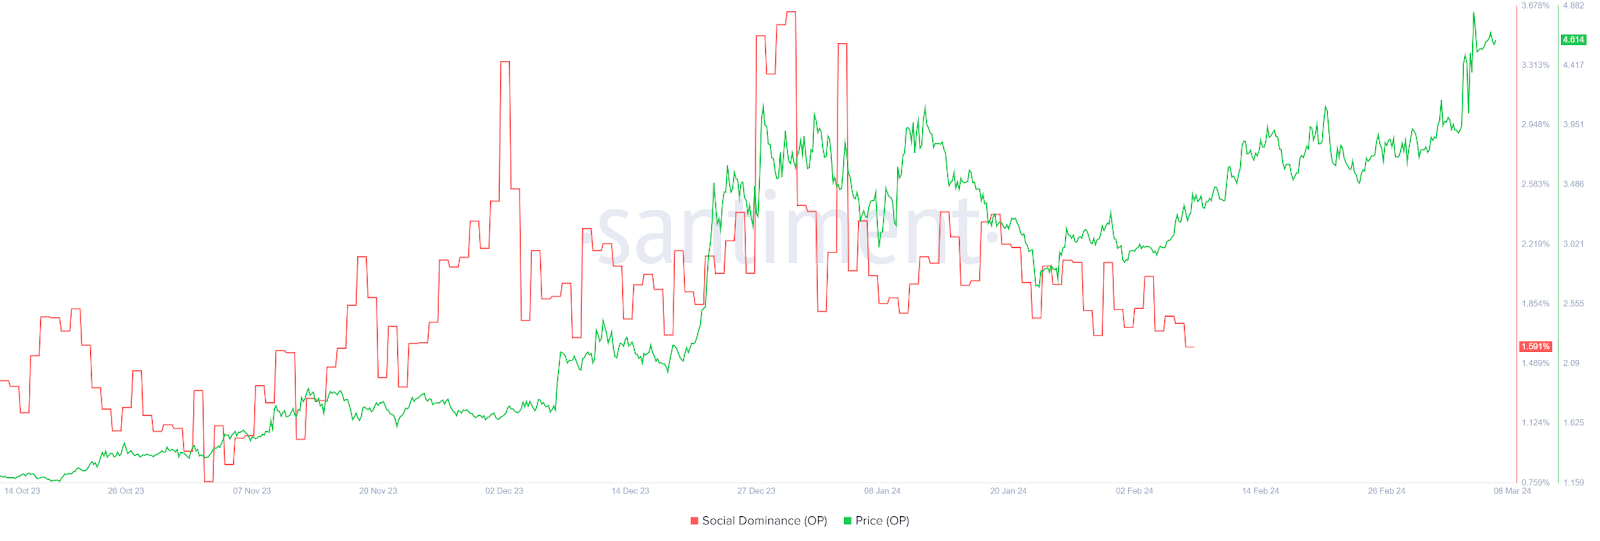
Since the start of 2024, the optimism token price has grown seamlessly and witnessed a rise of over 90% in the last three months. However, the social interest data saw a decline of over 110% to only (1.78) which signifies the low interest of users in the Optimism token.
Optimism (OP) Technical Indicators Outlook
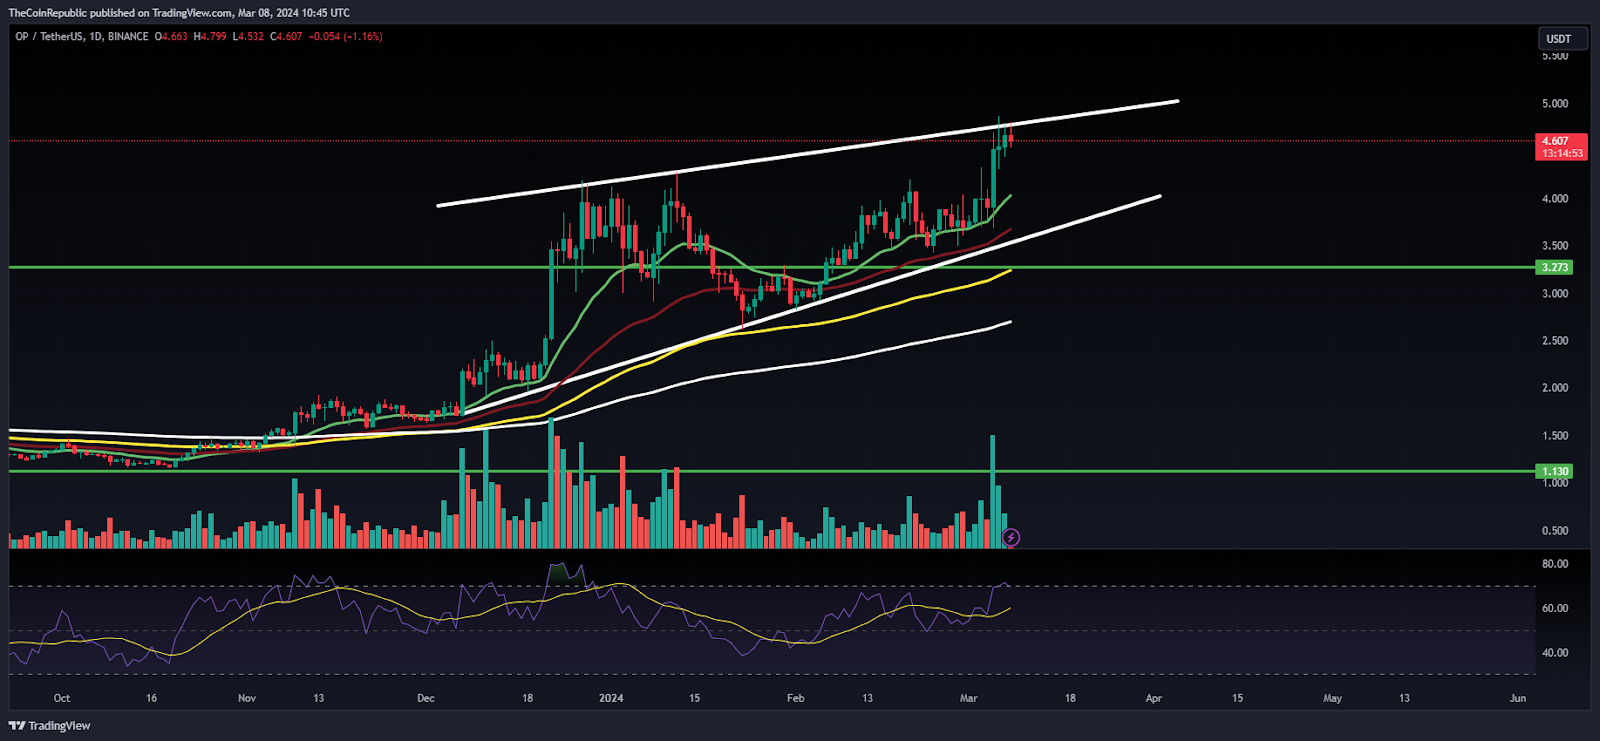
The Optimism token witnessed a rising wedge pattern in the daily timeframe and signified the higher high swings in the past sessions. The token trades above the key moving averages, indicating the bull accumulation.
The Relative Strength Index (RSI), a momentum indicator, conveys the overbought signal and indicates the bullish momentum on the charts. Similarly, the MACD indicator signifies a bullish crossover, suggesting the outperformance for the following sessions.
Summary
The Optimism token (OP) price delivers buying momentum and is close to the upper trendline of the $5 mark, which signifies the uptrend. Moreover, the token is trading in the bullish region, and further upward movements toward $6 may be seen in the following sessions.
Technical Levels
Support Levels: $4.30 and $4
Resistance Levels: $5.60 and $6
Disclaimer
The views and opinions stated by the author or any other person named in this article are for informational purposes only and do not constitute financial, investment, or other advice.
Steve Anderson is an Australian crypto enthusiast. He is a specialist in management and trading for over 5 years. Steve has worked as a crypto trader, he loves learning about decentralisation, understanding the true potential of the blockchain.


