
 Home
Home News
News

- 1 The TRX price lags momentum and intends to retest the 50-day EMA mark.
- 2 Tron crypto’s volatility rate reduced by 3.65% to 0.00951, implying profit booking at highs.
The Tron (TRX) price witnessed a range breakout and surged over 20% in the last 20 trading sessions. However, the trend is intact, and the coin may soon bounce toward the $0.1500 mark. Furthermore, the price action signifies the follow-on buying momentum since the start of February and has witnessed higher high swings for the past weeks. This surge replicates the investors’ interest and conveys the potential bull run of the coin in recent sessions. However, the bulls are taking a nap, and a retracement is now witnessed on the charts.

The Tron coin (TRX) price was retraced to the 20-day EMA mark, signaling uncertainty among investors. Moreover, the price action signifies consolidation, and sellers are actively engaging and likely to push the TRX price toward the 50-day EMA mark. The volatility rate was reduced to 0.00951, and a drop of over 3% was noted in the last seven sessions, conveying the profit booking at the highs. Additionally, a down move toward the support zone of $0.1300 can be seen in the following sessions.

The Tron coin (TRX) price was $0.1374 at press time, with an intraday drop of 0.77%, showing retracement on the charts. Moreover, the trading volume has dropped by 4.90% to $455.01 Million. The TRON coin has a monthly return ratio of 13.26% and 109.81% on a yearly basis. The pair of TRON/BTC is at 0.00000205 BTC, and the market cap is $12.27 Billion. Analysts are bullish and suggest that the TRON coin price may reach $0.1500 soon.
TRON Price Witnessed Bull Accumulation: Can TRX Continue To Advance Gains?
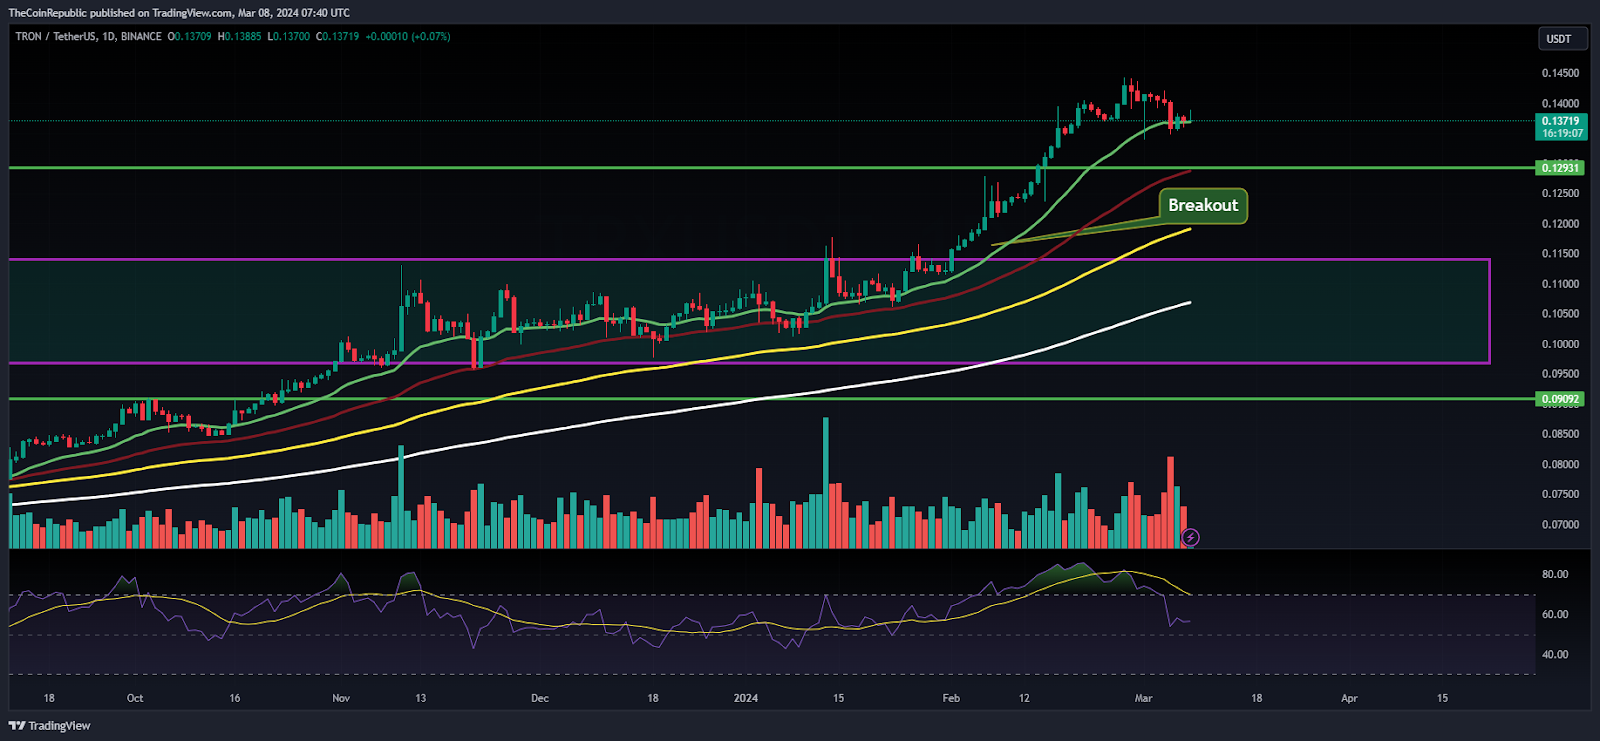
The daily charts of the Tron coin signify a continuation of the bull run, and the price persisted in heading upward for the past sessions. However, the price action suggests a higher low formation at the top, which may lead to a short-term correction.
The Relative Strength Index (RSI) curve fell to 60 and is close to the midline replicates retracement on the charts. Similarly, the MACD indicator shows a bearish crossover and suggests a correction for the following sessions.
Price Volatility and Weighted Sentiment Outlook on the Daily Timeframe
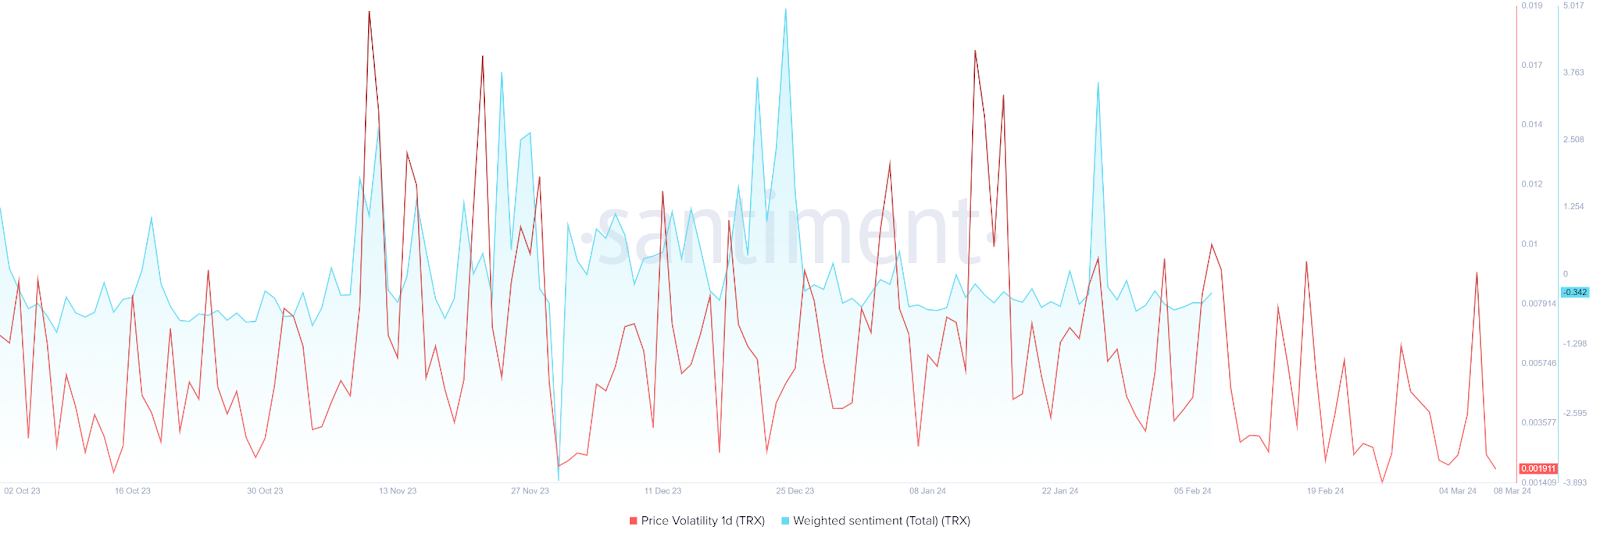
As per the data from Santiment, the weighted sentiment slightly increased this week but remains at -0.342, replicating a neutral outlook. However, the volatility rate sharply fell, indicating a negative outlook. Fear, Uncertainty, and Doubt (FUD) signify the negative outlook and exhibit greed among the investors.
Summary
The Tron coin (TRX) price witnessed an uptrend and portrayed bullish sentiments on the charts. Moreover, the coin has attained momentum and is ready to lift gains above the $0.1500 mark soon.
Technical Levels
Support Levels: $0.1300 and $0.1250
Resistance Levels: $0.1500 and $0.1600
Disclaimer
The views and opinions stated by the author or any other person named in this article are for informational purposes only and do not constitute financial, investment, or other advice.

Steefan George is a crypto and blockchain enthusiast, with a remarkable grasp on market and technology. Having a graduate degree in computer science and an MBA in BFSI, he is an excellent technology writer at The Coin Republic. He is passionate about getting a billion of the human population onto Web3. His principle is to write like “explaining to a 6-year old”, so that a layman can learn the potential of, and get benefitted from this revolutionary technology.


