


Arweave primary function is to facilitate endless and immutable data storage. It shows that the users can store important information, documents, and even apps, knowing that the data will be preserved indefinitely.
The AR token is the native cryptocurrency and is used within the Arweave network. It has several functions, including paying for storage and bandwidth, staking to participate in the consensus mechanism, voting for network upgrades, tipping content creators, and purchasing goods and services on the Arweave marketplace.
Let’s Explore What Do AR Crypto Price, Volume, and Market Cap Demonstrate.
The Arweave chart shows the relationship between the AR token’s volume and price. Looking at the chart, it is observed that both asset volume and price were low in January. That meant a lack of interest and activity in the market for the AR token. Volumes were mostly under $50 million and prices were around $10.
However, in the second week of February, volume and price continued to rise, indicating increased demand and excitement about Arweave crypto price. The trading volume exceeded $100 million and the price rose drastically from $10 to $44.
Moreover, at press time, the current volume is 300.41 Million, and the market capitalization is 2.9 billion. Investing in assets with considerably higher market capitalization could be excellent as it often provides better liquidity. It assists in better investing and buying or selling assets more quickly and easily. It provides more renowned management over the investment done and also aids in potentially improving investors’ returns.
Similarly, studying market cap changes can reveal insights into potential price movements and overall market health over time.
Likewise, it is essential to consider the trading volume in conjunction with the market cap. A high market cap with low trading volume might indicate limited liquidity, making it harder to buy or sell without affecting the price, and a high trading volume might signify vast liquidity.
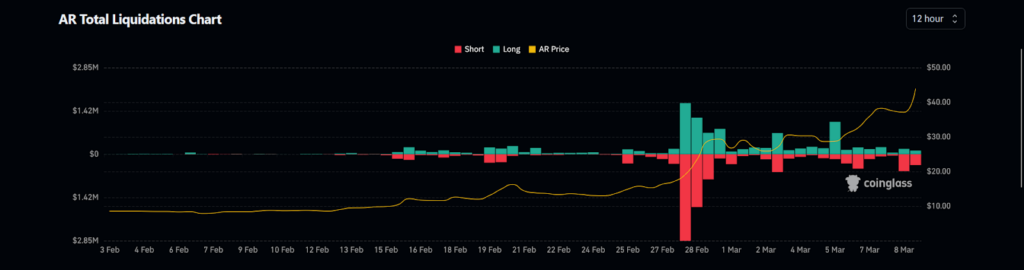
What Does AR Crypto’s Total Liquidations Chart Show?
According to Coinglass, open interest for Arweave (AR) is $112.47 million, up 38.24% from the previous session. The 24-hour long/short ratio is 0.9818, meaning there are more short positions than long positions. The total short positions opened in the last 24 hours is $944.49 K and long positions are $256.20 K.
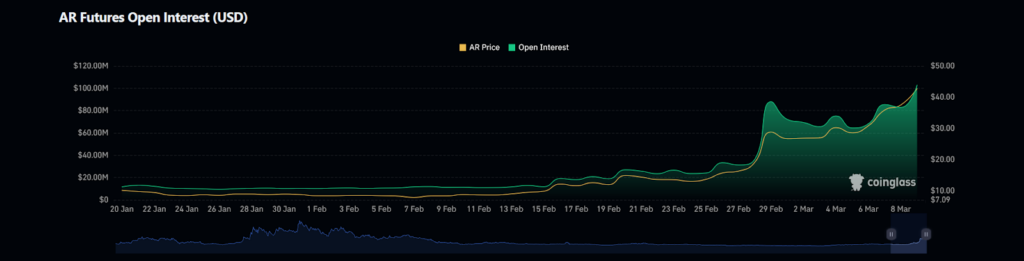
With reference to these metrics, it highlights that the AR crypto token is strongly bullish and the recent pump in the price is verified by these values. The OI shows the number of open contracts is at its peak, and liquidation on the short side is greater, which predict that the price could rise more.
What Does the AR Crypto Price Chart Highlight?
The Arweave crypto asset is showing bullish traits as its Market Cap, Volume, Liquidation, and OI are supporting the price. This scenario shows that it can achieve more growth.Similarly, on the price chart, it has demonstrated good performance during the past week, and month by 63.88%, and 427.43% respectively, indicating a reliable upward trend.
The AR crypto experienced a 3.11% surge in the last 24 hours, and it is currently trading at $44.0814 at press time.
Therefore, the Arweave crypto has displayed a strong revival as the price bounced back from a critical level of around $3.5 on the chart. If the AR crypto follows that bounced rally, it might continue to poise upward and the rally may keep going upwards to smash the resisting hurdle levels. It may soar to new heights towards testing the major supply level from the current price level.
Correspondingly, the AR asset is showing bullish strength and rising potential as it stays above major 20-day and 50-day EMA bands. Likewise, the asset is in a strong uptrend as the MACD shows a broad histogram, which is at 1.940 and shows a bullish crossover. The MACD line is at 7.488 and the signal line is at 5.545. Present daily chart conditions show a wider space towards the direction north and indicators appear to support the price.
Therefore, If demand for the AR token remains high, its price could reach $65. However, $50 would be the primary resistance level.
Another possibility would be, that if the Arweave crypto price fails to stay above the $40.0 price level, it could decline further.
AR Crypto Bullish by Sam_TCR on TradingView.com
Summary
The AR token’s volume and price were low in January. However, the second week of February indicated increased demand.
Investments in assets with considerably higher market capitalization could be excellent as it often provides better liquidity. Likewise, the OI shows the number of open contracts is at its peak, and liquidation on the short side is greater.
Therefore, If demand for the AR token remains high, its price could reach $65, but $50 would be the primary resistance level.
Technical Levels
Support Levels: $1.25
Resistance Levels: $2.00


