
 Home
Home News
News
- 1 GALA token price chart shows a sharp jump from the $0.06000 mark.
- 2 The technical indicators suggest a breakout is likely amid bulls’ dominance.
The Gala token (GALA) price replicates massive whale activity and pumped over 40% in the last 24 hours. Moreover, the token has glimpsed an intense breakout with follow-on bullish marubozu candlesticks.
This week, Gala Games partnered with Alienware and Amazon Web Services (AWS) to conduct a hackathon program at the 2024 Game Developers Conference (GDC). This positive development led to a spike in the price of the GALA token which surged over 90% this week. Following the crypto market surge, the token was in the investors’ eyesight and persisted in extending the gains.
At press time, the Gala token (GALA) price was $0.0676 with an intraday gain of 38.92%, indicating massive bullishness on the charts. It has a weekly return ratio of 43.37% and a monthly return ratio of 193.80%. The pair of GALA/BTC is at 0.000000961 BTC, and the market cap is $502.10 Million. Analysts are bullish and suggest that the GALA token price will persist in advancing gains and may retest the $0.08000 mark soon.
Gala Gains Momentum, Can Bulls Hold Their Domination?
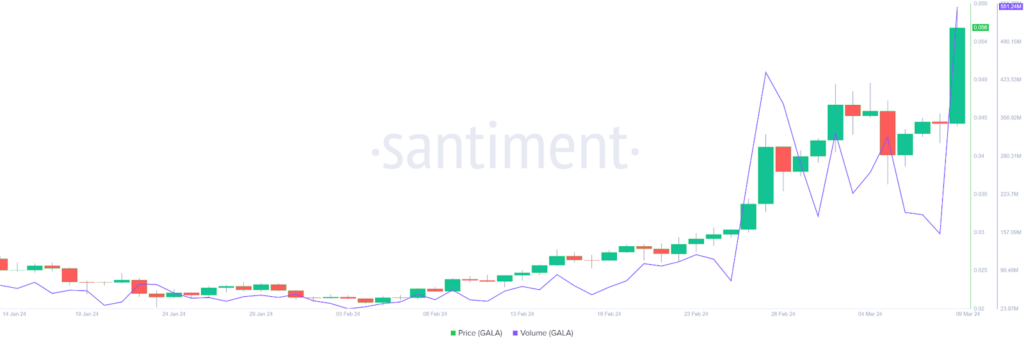
The Gala price (GALA) furnished a rise, jumping over 90% this week. The token displayed a massive spike in trading volume of over 500% and surged to $1.10 Billion in the last 24 hours. This huge spike in volume reflects the institutional buying activity and investor interest, leading to the surge in the token price.
GALA Reflects Volatile Moves and Bullish Sentiments
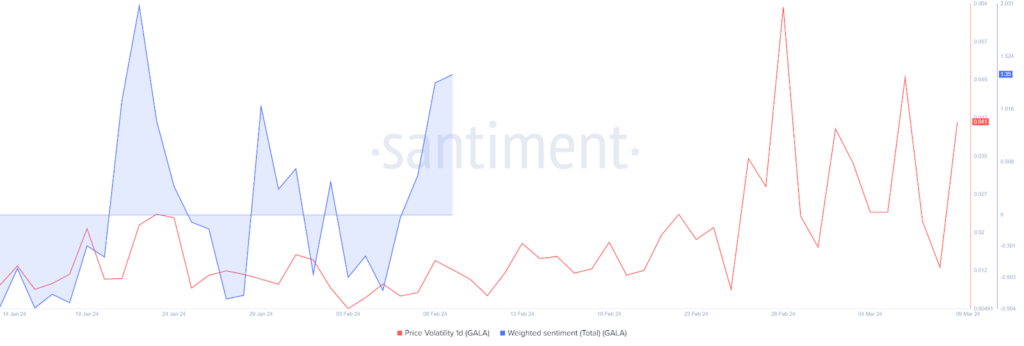
The price volatility curve is up over 30% to 0.041, indicating immense volatility on the chart. Additionally, the total weighted sentiment echoes a spike, and the curve stays at 1.35, alluding to the positive outlook for the following sessions.
Gala Transaction Volume Activity Analysis
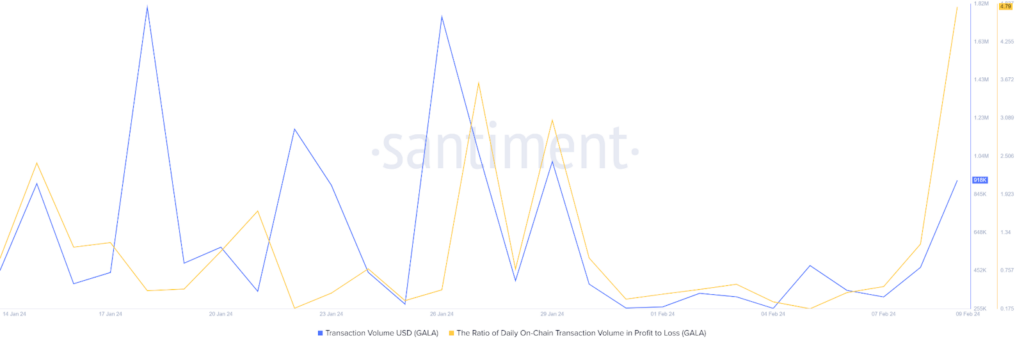
The transactional volume activity data rose over 30% to $928k last month. In contrast, the daily on-chain transactional value ratio also spiked, and the data illustrates a jump of over 400% to 4.79.
GALA Displays Falling Wedge Breakout, Can It Surpass 100 Day EMA Mark?
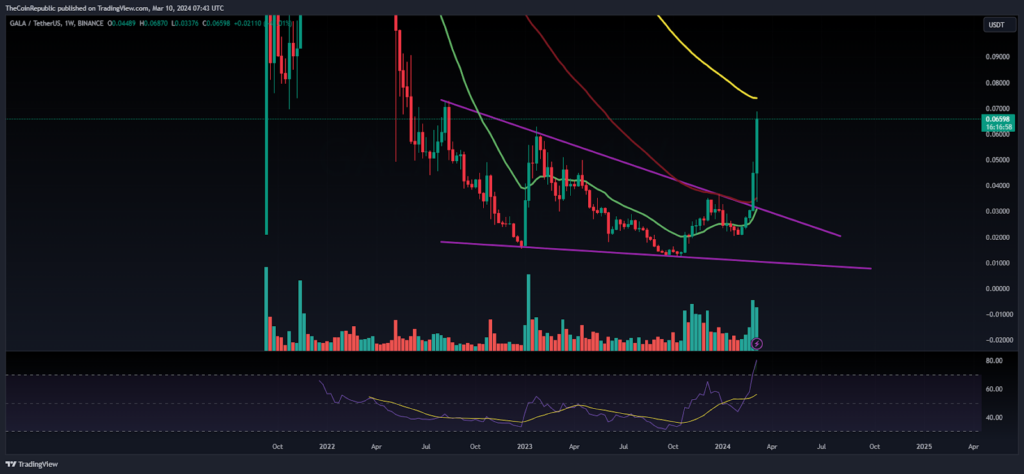
The Gala token displays a falling wedge breakout and reflects a sharp spike on the daily charts. Moreover, the token has surpassed the 50-Day EMA mark and is aggressively heading to the 100-Day EMA mark near $0.07000 under bullish momentum.
The Relative Strength Index (RSI) curve is in the overbought zone, reflecting outperformance on the charts. Similarly, the MACD indicator shows a bullish crossover and articulates a positive outlook.
Summary
The Gala token (GALA) noticed a breakout and is steering toward the upside hurdle of $0.07000. Moreover, the token represents the bullish momentum and has glimpsed investor interest for the past weeks.
Technical Levels
Support Levels: $0.06500 and $0.06300
Resistance Levels: $0.06800 and $0.07000
Disclaimer
The views and opinions stated by the author or any other person named in this article are for informational purposes only and do not constitute financial, investment, or other advice.

Nancy J. Allen is a crypto enthusiast, with a major in macroeconomics and minor in business statistics. She believes that cryptocurrencies inspire people to be their own banks, and step aside from traditional monetary exchange systems. She is also intrigued by blockchain technology and its functioning. She frequently researches, and posts content on the top altcoins, their theoretical working principles and technical price predictions.


