
 Home
Home News
News
- 1 UNI price chart reflects profit booking, dropping over 17% in the last three sessions.
- 2 The rejection of the proposal triggered negativity among investors.
The Uniswap price witnessed the profit booking at the highs of $15 and retraced over by 18% in the last three trading sessions. However, the trend still favors the bulls, but the investors are cautious. This month, the token price has rallied around 100%, and the bear army is desperate to initiate a selloff for the past sessions.
As per the media reports, the community rejected a proposal regarding the UNI V3 fees mechanism, and an unfavorable outcome was noted on the charts. Despite the global positivity, the token exhibits selling pressure.

At press time, the Uniswap token (UNI) price was $14.10, with an intraday drop of 0.23%, indicating neutrality on the charts. It has a weekly return ratio of 11.79% and a monthly return ratio of 123.15%. The pair of UNI/BTC is at 0.000202 BTC, and the market cap is $12.26 Billion. Analysts are bullish and suggest that the UNI token price will continue to stretch the rally and may catch the $20 mark soon.
Uniswap Price Near Its Foremost Hurdle, Is A Trend Reversal Possible?
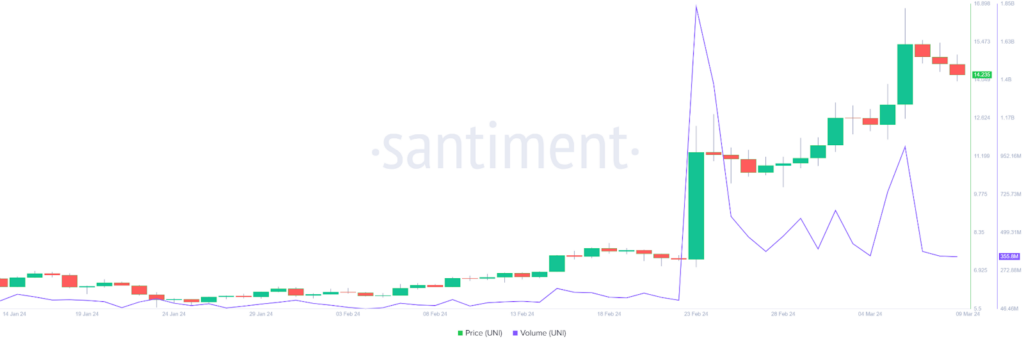
The Uniswap token (UNI) witnessed the sellers’ attempt to push the token toward its 20-Day EMA, and the follow-on bearish doji candlestick was reflected in the last three sessions. However, the price retracement occurred with low volume, which did not affect the investors much. Also, buyers entered the dip, which was a positive sign.
Uniswap Price Volatility Keeps Lowering, What’s Next?
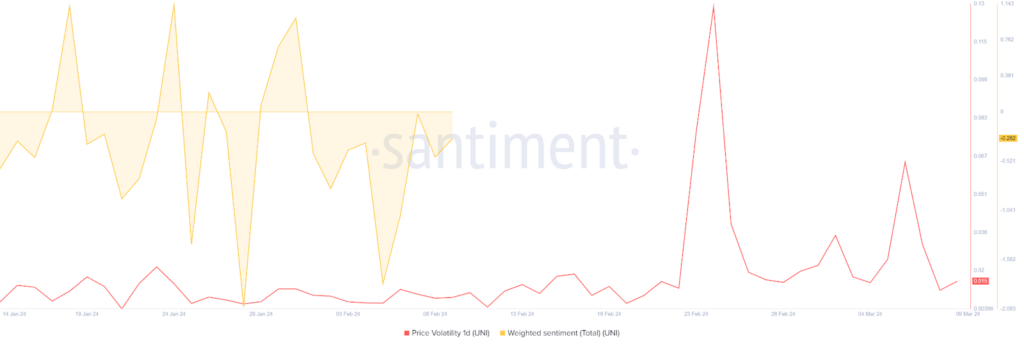
The token witnessed a decline in volatility, and a drop of over 40% in the last three sessions was noted. The volatility curve near 0.015 signifies steady price movements and a neutral trend for the following sessions. The total weighted sentiment curve shows a spike from the negative mark of 1.788 to 0.0282. However, the curve did not achieve the midline and stayed in the negative zone amidst the sharp rise this month.
Social Dominance And Development Activity Outlook
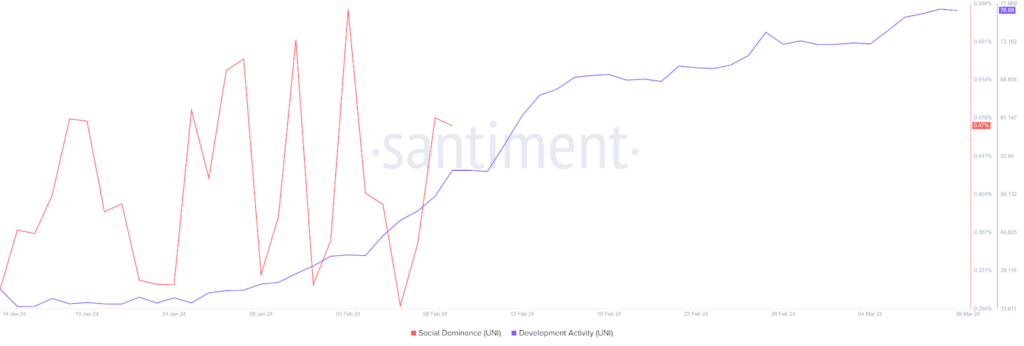
The UNI token revealed a rise in social dominance, and the curve glimpsed a surge of over 40% this month. The data indicates that the token was in the discussions and the limelight on social media platforms due to the significant rally this month. The development activity is on the rise, and the curve skyrocketed over 35% to 76.69 amid the positivity.
Uniswap Witnessed Profit Booking, Can Bulls Hold UNI Above 20-Day EMA Support?

The Uniswap token price signifies an uptrend and sustains the gains in the blue sky zone, which are close to $14. However, the last three candlesticks suggest that sellers intend to initiate a selloff toward the 20-Day EMA mark and may extend the retracement to the $13 mark soon.
The Relative Strength Index (RSI) curve floats in the overbought zone and reflects a positive outlook on the charts. Furthermore, the MACD indicator shows a bullish crossover and conveys an optimistic view for the following sessions.
Summary
The Uniswap price trades in the bullish trajectory and decisively holds the gains above the key moving averages. Furthermore, the trend is intact, and a further bounce toward the $20 mark can be anticipated soon.
Technical Levels
Support Levels: $13.80 and $13.00
Resistance Levels: $14.60 and $15.70
Disclaimer
The views and opinions stated by the author or any other person named in this article are for informational purposes only and do not constitute financial, investment, or other advice.

Adarsh Singh is a true connoisseur of Defi and Blockchain technologies, who left his job at a “Big 4” multinational finance firm to pursue crypto and NFT trading full-time. He has a strong background in finance, with MBA from a prestigious B-school. He delves deep into these innovative fields, unraveling their intricacies. Uncovering hidden gems, be it coins, tokens or NFTs, is his expertise. NFTs drive deep interest for him, and his creative analysis of NFTs opens up engaging narratives. He strives to bring decentralized digital assets accessible to the masses.


