
 Home
Home News
News

- 1 The RUNE coin price signifies a sharp up move and is trading close to the $10 mark.
- 2 The Bulls are looking aggressive and attempting to stretch the rally.
The THORChain (RUNE) coin price reveals an up move and is reaching the bullish trajectory near the $10 mark. The price action signifies a follow-on bullish momentum and a golden crossover was noted on the daily charts. Additionally, the technicals are delivering short covering moves, hints that the bear cartel, who have made their solid grip near $10, look trapped and are in a panic situation.

At press time, the Thorchain coin (RUNE) price was trading at $9.71 with an intraday gain of 5.40%, indicating bull accumulation on the charts. It has a monthly return ratio of 90.06% and 629.68% on a yearly basis. The pair of RUNE/BTC is at 0.000135BTC, and the market cap is $2.93 Billion. Analysts are bullish and suggest the RUNE coin price will persist in skyrocketing and may catch the upside of $15 in the following sessions.

Thorchain Price to Trading Volume Profile Analysis
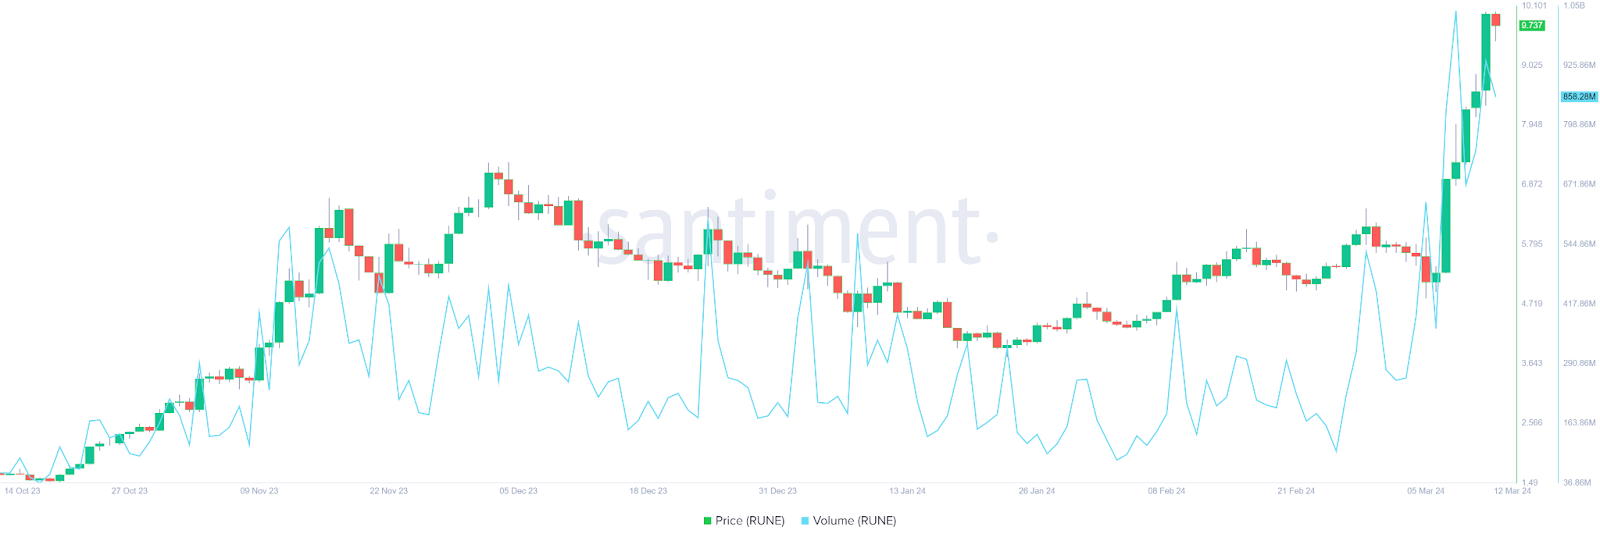
Since the beginning of this month, the price action revealed a sharp buying interest, and a rally was noted on the charts. The coin has jumped over 45% to the $9.70 mark following the volume spike of over 289.10% to $1.01 Billion. The overall metric data indicates a bullish outlook and positive investor interest.
What Do the Price Volatility and Development Activity Suggest?
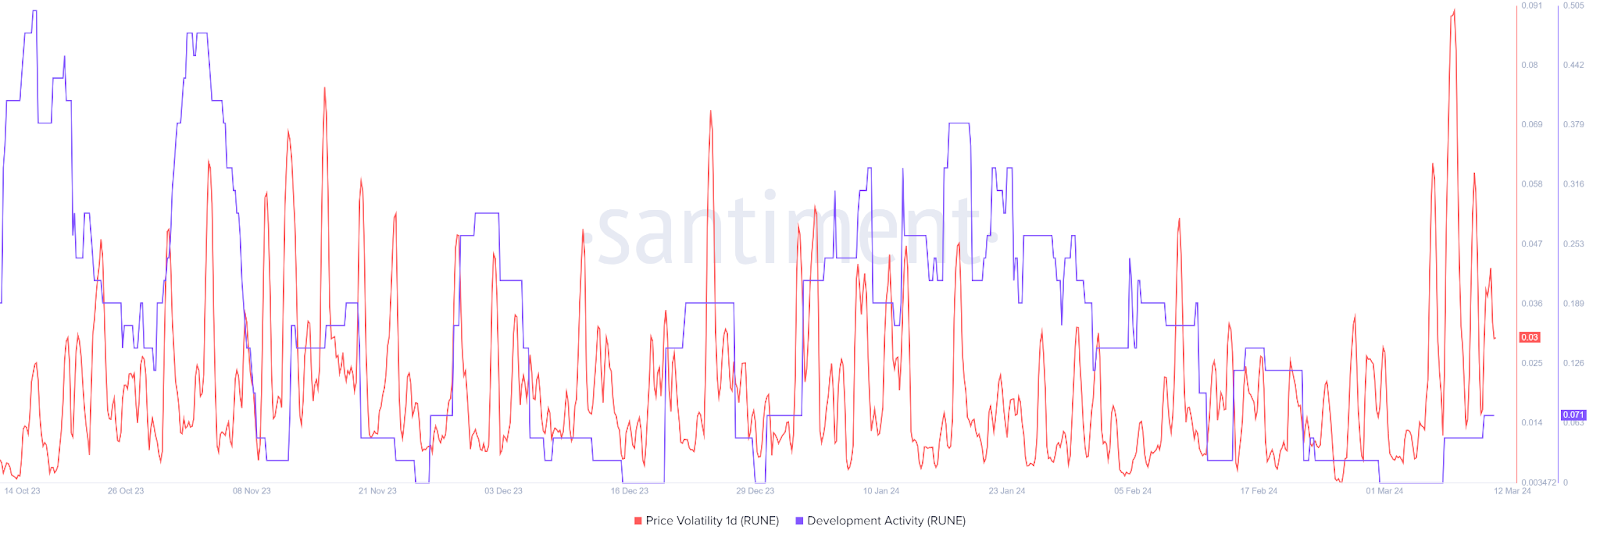
The fluctuating price volatility data indicates a massive trading activity, and investors are paying attention to the coin. This week, the volatility curve witnessed a sharp spike to 0.089. However, the intraday volatility declines to 0.03, reflecting a steady price movement. Additionally, the data indicates that the value of development activity keeps rising and surged over 25% to 0.071 this week.
Social Dominance and Open Interest (OI) Analysis
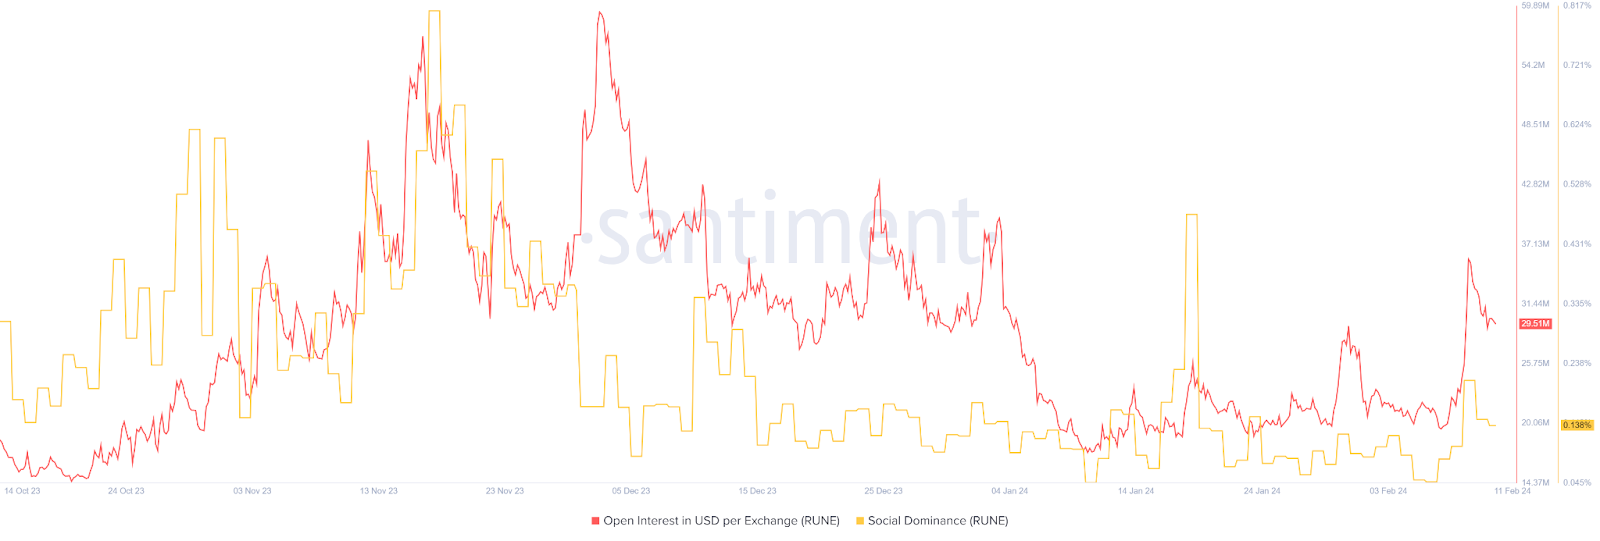
As per the data, the social dominance curve indicates a pullback this month and lifts around 36% to 0.138%, revealing a positive discussion media reports led to a rise in the price value of the coin. Additionally, the derivative data resembles the long buildup activity, and the open interest jumps over 10.16% to $178.95 Million.
The circulating supply of the RUNE coin is 300.76 Million, and the total supply is 500 Million. The volume-to-market cap ratio is 0.343, and the coin stands at 46th in the crypto market.
RUNE Indicates Breakout; Can Bulls Lift RUNE Above $10?
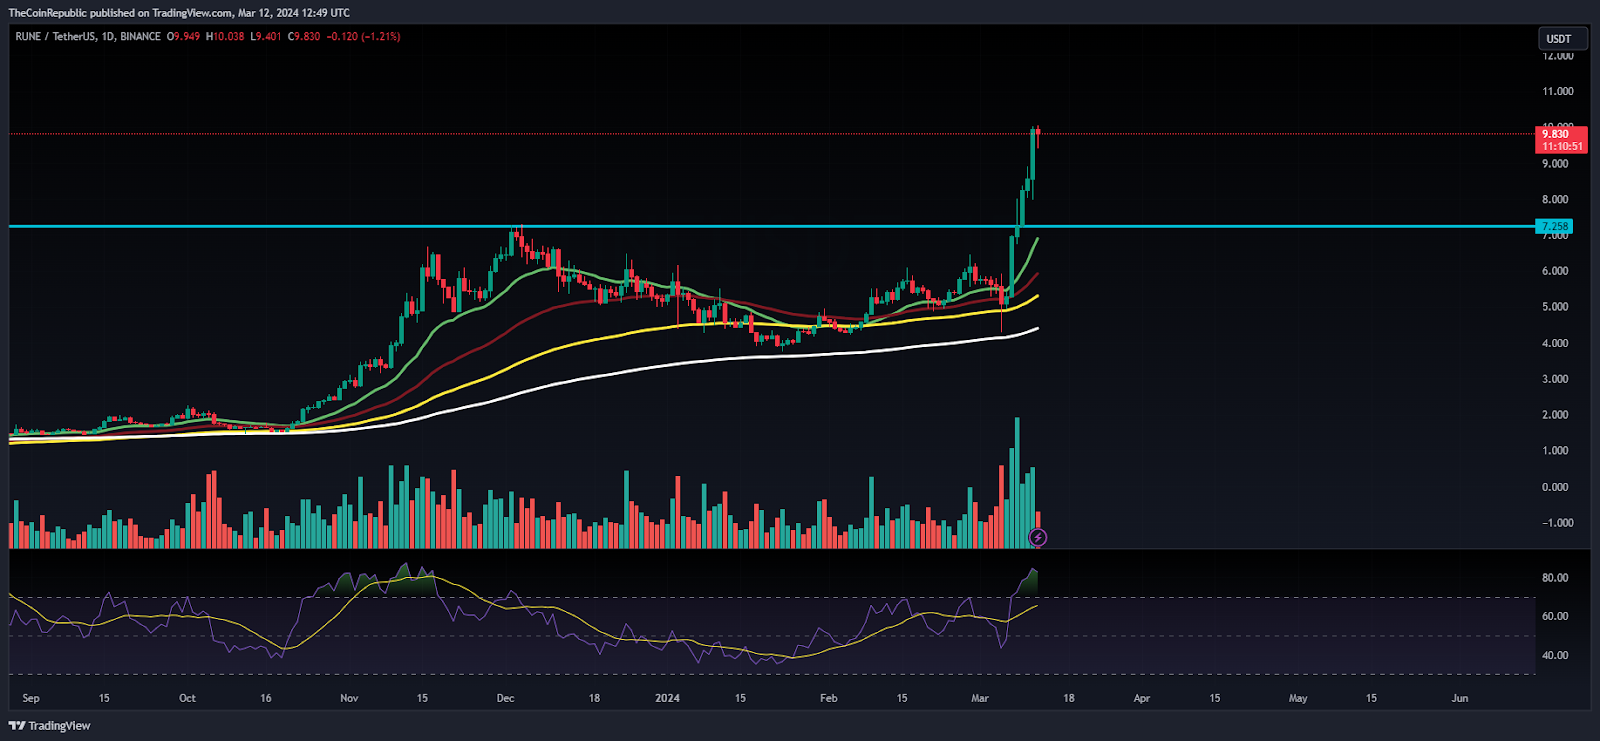
The coin has been in a range for the past weeks and is hovering near its 20-day EMA support mark of nearly $6 on the daily charts. Following the market bullishness, the RUNE coin triggered a sharp-up move and delivered a breakout in the recent sessions. This breakout led to a surge of over 120% this month and is still exceeding the hurdles.
The Relative Strength Index (RSI) curve stays in the overbought above 70, revealing a positive crossover on the charts. Moreover, the MACD indicator shows a bullish crossover and persists in forming the green bars, signifying the bull accumulation.
Summary
The RUNE coin price witnessed a sharp bullish movement, lifting the gains with a substantial volume for the past sessions. Additionally, the bulls are looking aggressive and are keen to surpass the prompt hurdle of $10 to unlock further upside.
Technical Levels
Support Levels: $9.20 and $8.80
Resistance Levels: $10 and $10.80
Disclaimer
The views and opinions stated by the author or any other person named in this article are for informational purposes only and do not constitute financial, investment, or other advice.
Anurag is working as a fundamental writer for The Coin Republic since 2021. He likes to exercise his curious muscles and research deep into a topic. Though he covers various aspects of the crypto industry, he is quite passionate about the Web3, NFTs, Gaming, and Metaverse, and envisions them as the future of the (digital) economy. A reader & writer at heart, he calls himself an “average guitar player” and a fun footballer.


