
 Home
Home News
News
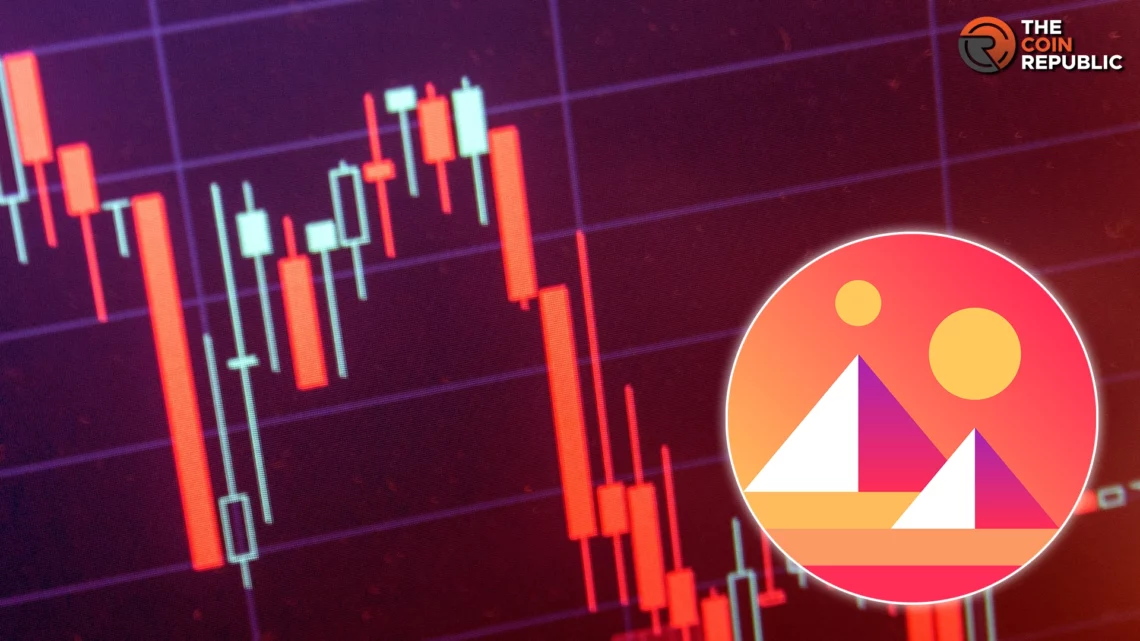
- 1 The Mana Price is declining for the 3rd consecutive day and has retraced the 200-day EMA.
- 2 When writing, the Decentraland crypto traded at 0.507, reporting a negative intraday development of 1.66%.
The MANA price has been on the losing side for the third consecutive sessions on Saturday. The recent fall has taken the price near the 200-day exponential moving average.

The daily chart shows that Decentraland crypto made a breakdown of the range formed over the daily chart. The breakdown has validated the possibility of further corrections to the price.

Earlier, MANA crypto maintained a positive trajectory after a breakout in February till mid-March. However, a sharp selling was observed from the monthly highs in the later weeks of March and has made a breakdown of 20-day EMA. However, the 50-day EMA acted as a dynamic support, and a consolidation was observed in the last few weeks.
The MANA price noted a breakdown yesterday and dropped near the 200-day EMA. However, the 200-day EMA may act as a dynamic support, and the price may surge higher.
The long-term trend remains positive until the price exceeds the 200-day EMA. However, the short-term trend has undergone a correction phase. Now, if the bulls are able to surpass the 50-day EMA after sustaining above the 200-day, it may indicate a termination of a correction phase, and the price may rise again.
MANA Crypto Active Addresses Analysis
The active addresses display the number of addresses actively participating in the transactions of the MANA cryptocurrency. The above chart depicts the number of 24-hour active addresses and 7-day active addresses in correlation with the price.
At press time, the number of 24-hour active addresses was 775, and the 7-day active addresses were 5326. Moreover, the trajectory of the active addresses witnessed significant growth in February and the first two weeks of March. However, a decline in the number of active addresses has been observed in the last few weeks.
Top Addresses Are Offloading: Will Selloff Continue?
The above chart depicts the supply held by the top addresses in correlation with the Decentraland price. As per the data, the supply held by the top addresses has been declining continuously since January. The top addresses are offloading their holdings in the MANA crypto.
Looking precisely at the data, the top addresses were holding 45.5% of the total supply in the 1st week of January. The MANA price noted an uptick in February; however, the top addresses kept offloading continuously despite a short-term hike in the price. Since January, the whales have offloaded a significant supply of nearly 2% and currently hold 43.5% of the total supply.
MANA Crypto: OI Data Insights
The recent sessions witnessed a sharp selloff from the monthly high value. The Open Interest contracts curve also seems to follow the same curve, dropping nearly 30% in the last few weeks. The total number of open contracts in the 1st week of March was $45.95 Million, which has dropped to nearly $32.1 Million at the current time.
MANA Crypto Forecast April 2024
The analysts have a wide range of price targets for April 2024. The most optimistic view of analysts assumes the MANA price could advance to a high of $0.694, suggesting a potential gain of over 36.31%. The lower price target that the crypto could attain, as per the analysts, is $0.396 if it breaks below the 200-day EMA.
Conclusion
MANA Price has declined for the last three days, nearing the 200-day EMA. Witnessing a breakout in February, Decentraland crypto faced a sell-off in March, breaching the 20-day EMA, but got support at the 50-day EMA. The recent breakdown has dragged the price near the 200-day EMA and could signal a rebound if sustained.
Despite short-term corrections, The long-term outlook remains bullish above the 200-day EMA. Active addresses spiked in early March but have decreased in the last couple of weeks. Currently, there are 775 daily and 5326 weekly active addresses, indicating fluctuating user activity.
Technical levels
- Support levels: $0.47 and $0.396
- Resistance levels: $0.604 and $0.694
Disclaimer
The views and opinions stated by the author, or any people named in this article, are for informational purposes only and do not establish financial, investment, or other advice. Investing in or trading crypto or stock comes with a risk of financial loss.

With a background in journalism, Ritika Sharma has worked with many reputed media firms focusing on general news such as politics and crime. She joined The Coin Republic as a reporter for crypto, and found a great passion for cryptocurrency, Web3, NFTs and other digital assets. She spends a lot of time researching and delving deeper into these concepts around the clock, and is a strong advocate for women in STEM.


