
 Home
Home News
News
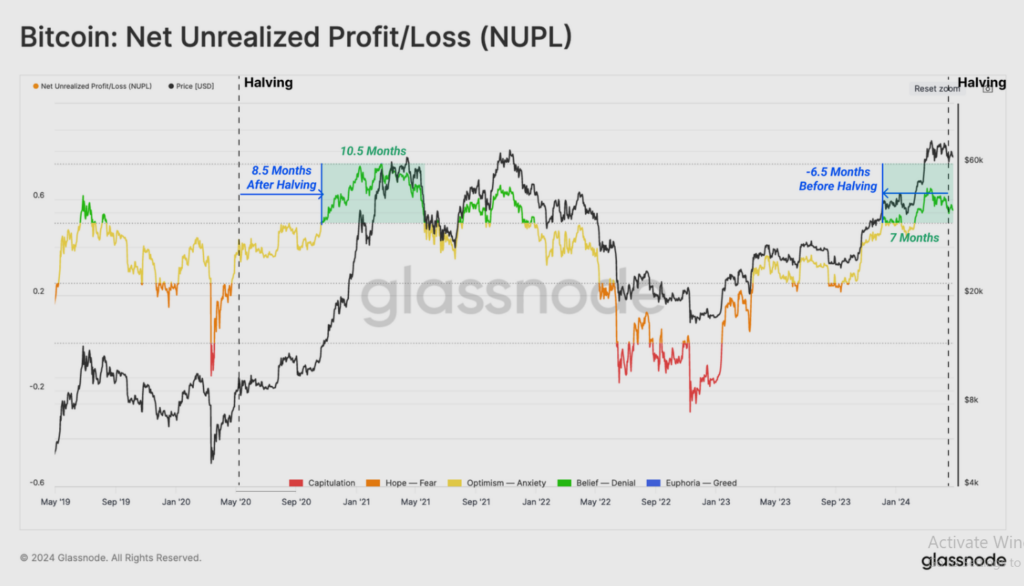
- 1 Based on the Bitcoin’s NUPL, the Bitcoin market is still in the Euphoria phase, but has decreased in intensity as the correction began.
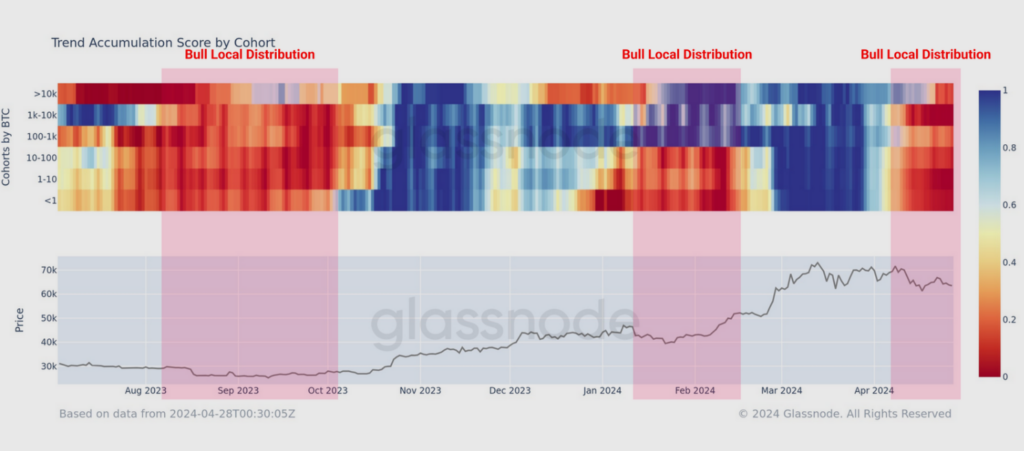
- 2 After reaching an all-time high of $73,000 in March, the Bitcoin market has shifted towards broad distribution, as coins capitalize on liquidity and increasing demand.
The crypto market is struggling with BTC consolidating around the $60,000 range. BTC price has been in a drawdown after reaching the all-time high of $73,000 mid-March.
Whenever the market rallies to new highs, sell side pressure increases as investors bring dormant supply back into the market to cater to the inflowing demand.
Bitcoin Net Outflows Increase
As BTC price achieved new all-time highs in mid-March, a similar bearish pattern observed after the previous bull cycles of local distribution was noticed. This bearish pattern was further intensified by news about the conflict in the Middle East, resulting in a correction.
When analyzing the breakdown of this metric by wallet sizes, it is evident that there is a clear uptick in net outflows across all cohorts throughout April, indicating a consistent sell-side pressure across the board.
Crypto Fear & Greed Index Flashing Neutral Signals
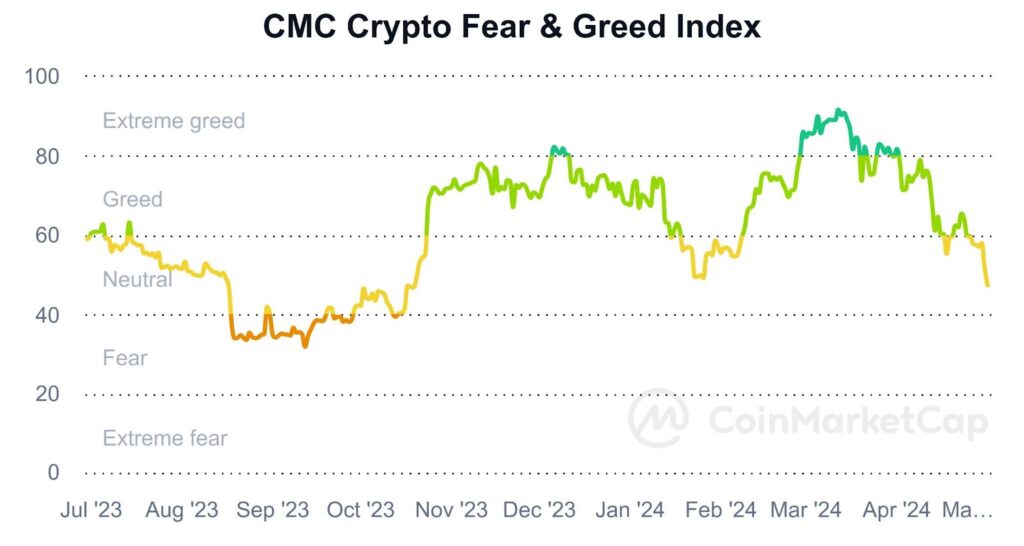
According to the CoinMarketCap data, the index pumped which took greed closer to 100 at 89.12 by the second week of March 2024, where BTC was around $73 K.
Thereafter, a new sharp decline in greed was observed, the last similar fall in fear and greed was observed towards the end of January this year. The drop in this metric highlights that the market sentiment starts dipping in fear as price takes a fall.
Net Unrealized Pain & Gain Cycles (NUPL) – Explained
The positive effect of US Spot ETF momentum on price action has been a unique characteristic of the current bull market. NUPL helps to explain the impact of ETFs on investor behavior. NUPL measures the magnitude of net paper profits (or losses) held by the market normalized by the market cap.
NUPL is useful in identifying the classic Euphoria phase of a bull market where unrealized profits surpass more than half the market capitalization size (NUPL > 0.5). In the 2020-21 cycle, this phase was triggered 8.5 months after Bitcoin halving and saw sustained upside for almost 10.5 months afterwards.
In this cycle, NUPL breached 0.5 approximately 6.5 months before the halving, and this distinct shift highlights the significance of US ETF in shaping and accelerating price action by introducing powerful demand into the market. By this metric, the Euphoria phase (NUPL>0.5) of this bull market has been in effect for the last 7 months.
However, even the mightiest up-trends experience corrections, and these events offer valuable information about investor positioning and sentiment.
Navigating Local Bottoms Formed In The Bitcoin Price Cycle
After confirming that BTC seems to be in the Euphoria zone and with an anticipation of corrections, the Realized Loss breakdown metric can be used to identify the current dominance of short-term holders or recent buyers.
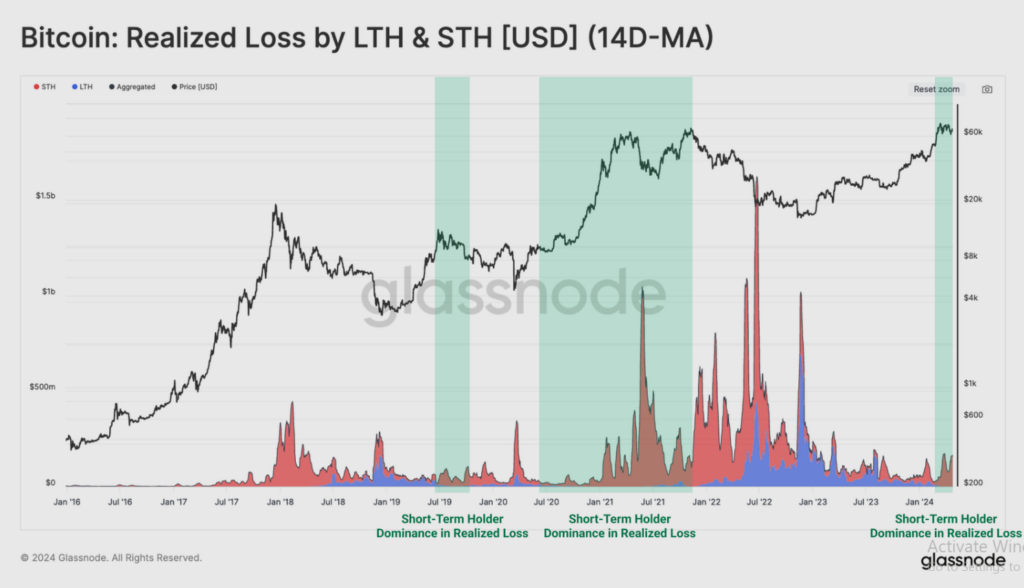
The younger age groups, specifically the 1 month to 3 months (1m-3m) and 3m-6m cohorts, can serve as useful tools in differentiating between bull and bear market structures. Meanwhile, the 1w-1m cost basis can help traders and investors identify market inflection points and determine potential local tops (in bear markets) and local bottoms (in bull markets).
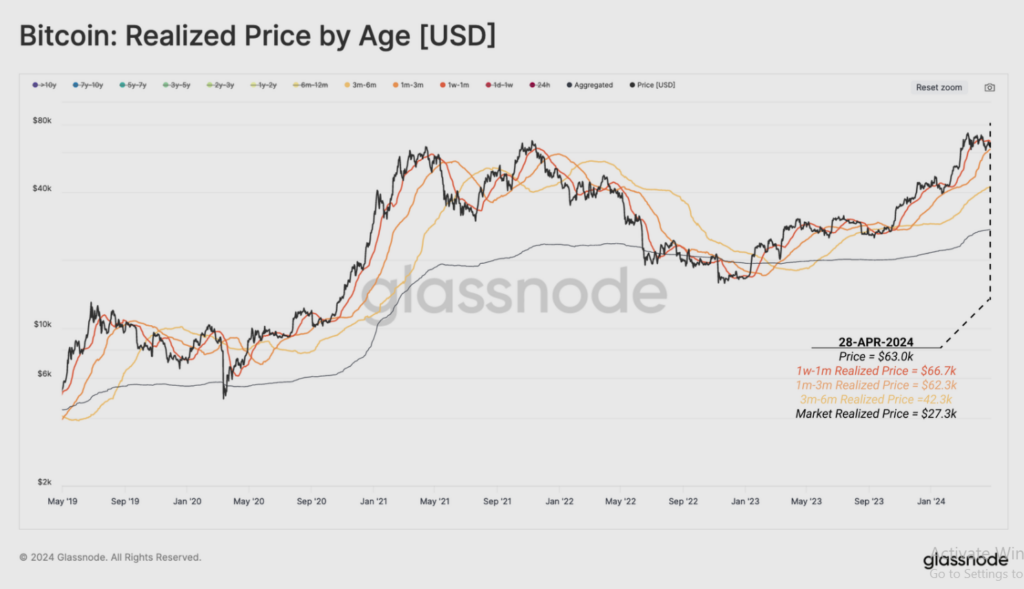
The 1w-1m cost basis, which considers short-term holder and long-term behavioral analysis, often influences the spot price. Recent buyers, who are more price-sensitive and likely to spend in the short term, contribute to this trend.
During bull market corrections, short-term holders may increase their spending as the market begins to sell off. Once the market price approaches each subcohort’s cost basis, their pace of spending can be expected to slow down due to seller exhaustion.
Similarly, the 1 week -1 month realized price (cost basis) chart can help identify potential points of seller exhaustion in the near term. It serves as a compass for traders and investors in determining when the pace of spending among short-term holders may slow down.
Typical Deviations During Corrections, Gauged By MVRV Ratio
The chart below indicates that during pullbacks in the bull market, the MVRV (1w-1m) ratio tends to decrease to the range of 0.9-1, which implies that the market typically drops by 0% to -10% below the 1w-1m investors’ average cost basis.
By gauging the implied pressure on 1w-1m investors, it is possible to trace the intensity of their panic and fear, which can be measured by the realized loss. One major approach is to identify the periods of aggressive selling pressure by this subgroup of investors.
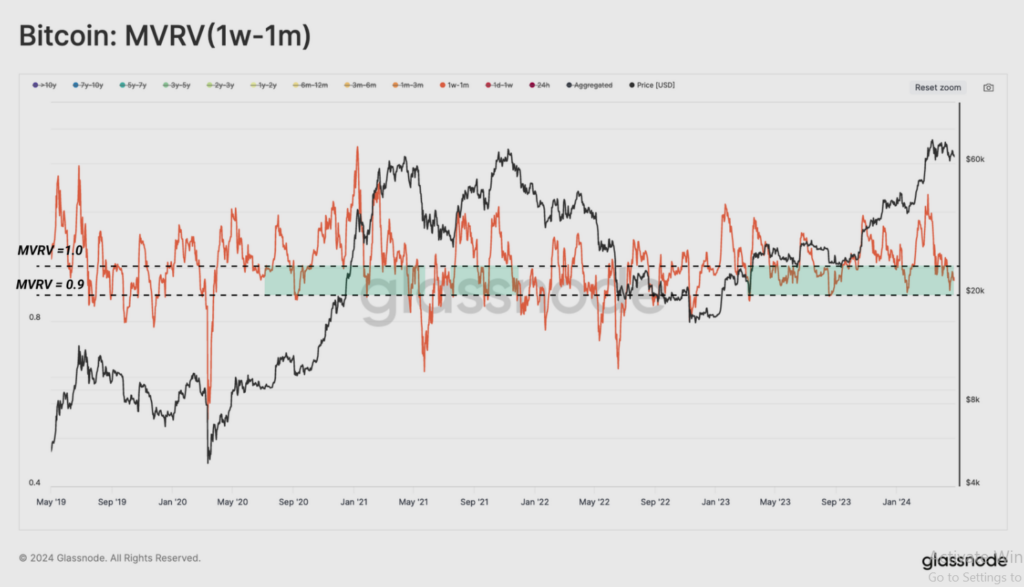
The asset also shows the realized loss by 1w-1m old entities, denominated in USD, which is useful in identifying the intervals of high-loss realization using some basic statistical methods, such as > 1 standard deviation.
Finally, the realized loss for this group tends to reach its peak near local market lows, as recent buyers panic sell their coins.
Summary
Bitcoin market consolidating around $60k after reaching an all-time high of $73k in March. Bull runs show confluence between distribution regimes and price intervals. New highs trigger sell pressure from investors. Increased sell-side pressure was seen in April. Market Fear & Greed Index spiked to 89.12 in March, then sharply declined. NUPL metric shows the impact of ETFs on market behavior, identifying the Euphoria phase in a current bull market.
Disclaimer
In this article, the views, and opinions stated by the author, or any people named are for informational purposes only, and they don’t establish the investment, financial, or any other advice. Trading or investing in cryptocurrency assets comes with a risk of financial loss.

Nancy J. Allen is a crypto enthusiast, with a major in macroeconomics and minor in business statistics. She believes that cryptocurrencies inspire people to be their own banks, and step aside from traditional monetary exchange systems. She is also intrigued by blockchain technology and its functioning. She frequently researches, and posts content on the top altcoins, their theoretical working principles and technical price predictions.


