
 Home
Home News
News
- The token is trading below the demand zone on the daily time frame.
- The pair of NEAR/USDT is trading at the price level of $2.383 with a gain of 1.23% in the past 24 hours.
The NEAR token has rebounded from the long-term demand zone with strong bullish momentum, with bulls driving up the token’s price. In the daily time frame, the token has crossed the 50 EMA and has sustained above it.

NEAR token on the daily chart
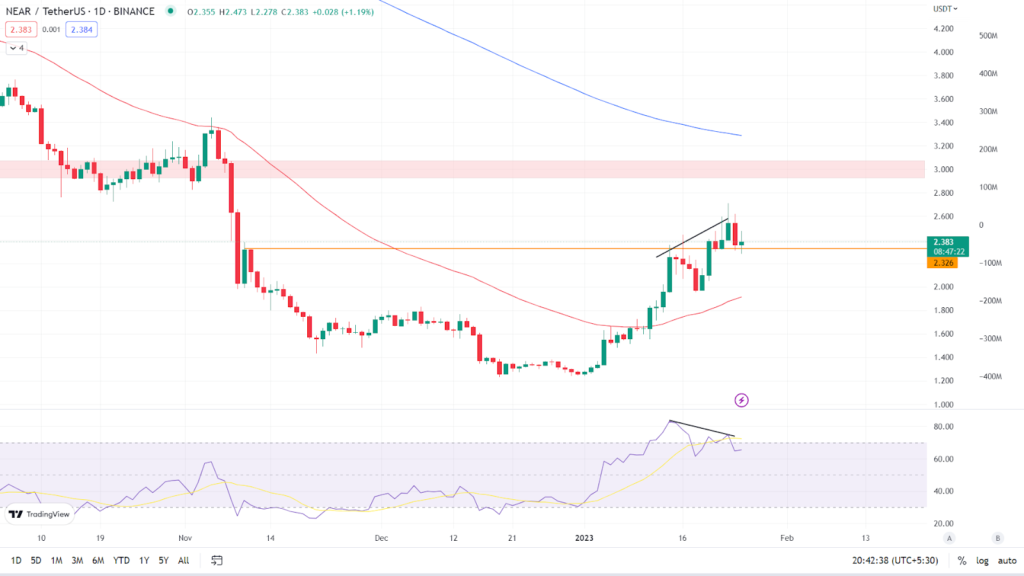
The bulls have broken out of the consolidation zone and are forming strong bullish candles on the daily time frame. According to the daily chart, NEAR token is now trading at $2.383, up 1.23% in the last 24 hours. It is now trading between the 50 EMA and the 200 EMA, which are the key Moving Averages. (Red line is 50 EMA and the blue line is 200 EMA). On the daily chart, a bearish divergence can be seen forming.

Relative Strength Index: The asset’s RSI curve is currently trading at 65.80 and is declining after hitting the overbought zone. The value of the RSI curve has increased as the token price has risen. The RSI curve has crossed below the 14 SMA. On the daily chart, a bearish divergence has formed. When the price makes higher highs while the technical indicator makes lower highs, this is known as bearish divergence.
Analyst view & Expectations
The token is having strong bullish momentum, however the indicator is indicating a bearish signal. Although the token has broken and sustained above the resistance level on the daily time frame, we cannot say that the bullish momentum will continue because the token is approaching the previous support level, which is now the token’s resistance level. Investors are advised not to buy unless there is a clear indication. Intraday traders, on the other hand, have a strong opportunity to go short if the token falls below the resistance level and book profits based on their risk-to-reward ratio.
According to our current NEAR Protocol price projection, the value of NEAR Protocol will fall by -7.23% and hit $ 2.22 in the coming days. Our technical indicators indicate that the current sentiment is bearish, with the Fear & Greed Index reading 51. (Neutral). Over the previous 30 days, NEAR Protocol had 16/30 (53%) green days and 23.86% price volatility. According to our NEAR Protocol forecast, now is not the time to buy NEAR Protocol.
Technical Levels
Major support: $1.812 & $1.963
Major resistance: $2.924
Conclusion
On a daily time frame, the token is trading below demand, and the RSI indicator is showing a bearish signal. It remains to be seen if the token continues its bullish momentum or whether the bears take command of the trend. Before investing, investors should wait for a clear indication.
Disclaimer: The views and opinions stated by the author, or any people named in this article, are for informational ideas only, and they do not establish the financial, investment, or other advice. Investing in or trading crypto assets comes with a risk of financial loss.

Nancy J. Allen is a crypto enthusiast, with a major in macroeconomics and minor in business statistics. She believes that cryptocurrencies inspire people to be their own banks, and step aside from traditional monetary exchange systems. She is also intrigued by blockchain technology and its functioning. She frequently researches, and posts content on the top altcoins, their theoretical working principles and technical price predictions.


