
 Home
Home News
News

- Ethereum Classic is trading bullish on the yearly time frame and now it is reaching towards the first supply zone on the higher side between $20-$25
- The coin is placed above all the major daily moving averages of 20,50,100 and 200-DMA
- The pair of ETC/BTC is trading slide ways above all the major moving averages standing at 0.0003244 BTC with an intraday loss of -4.99%
Ethereum classic price over the longer time frame is now reaching towards the resistance zone of $20 to $25. However, over the monthly chart volume is continuously decreasing with respect to time, which indicates a pullback is expected from higher levels. The volume over the monthly chart is below the average line, likewise, the ETH is successfully trading above all the major moving averages of 20,50,100 and 200-DMA. Support over the monthly chart is placed at $14 and $11.90, meanwhile, the resistance on the higher side is situated at $21.50 and $25.

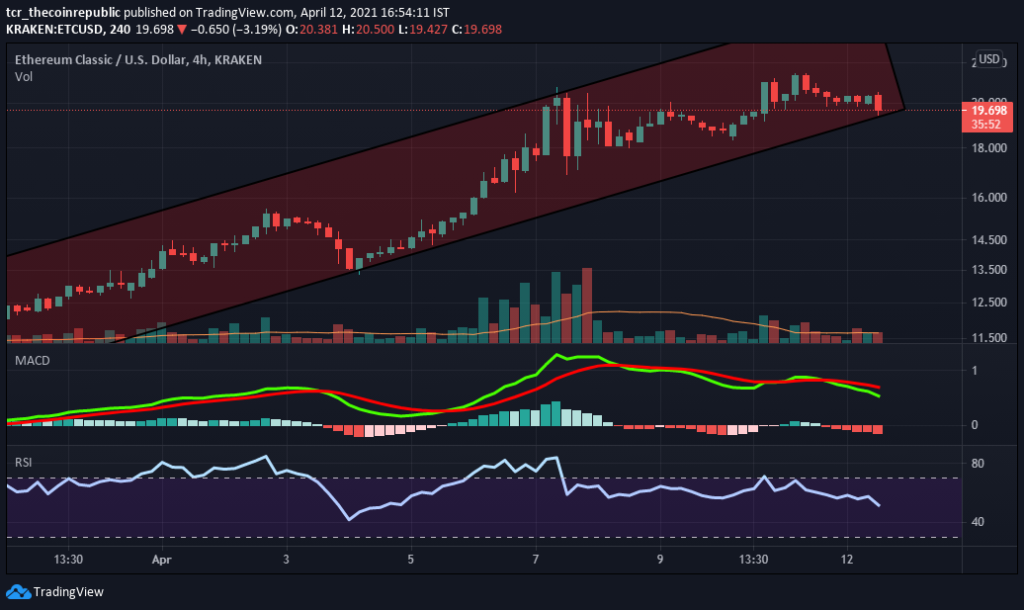
Over the weekly chart Ethereum classic price is trading on a bullish note, However, a sell-off is observed from higher levels. The coin indicates some weakness on the higher side, and retracement from the higher side is expected. The volume over a 4-hour time frame is low, which indicates less participation of buyers and sellers over the period of time. Currently, ETC is trading at the price level of $19.80 with an intraday correction of -3.28%, volume over the 24-hour dropped nearly -31.98% standing at $1,397,143,574. Total market capitalization plunged over -2.51% standing at $2,308,891,999. Support on the daily chart is placed at $18.40 and $17.90, meanwhile, resistance on the higher side is situated at $20.50 and $21.50.

The relative Strength Index (BEARISH) indicates bearish momentum while trading at 52.62. However, it is heading towards the oversold zone after testing the over brought zone.
Moving Average Convergence Divergence (BEARISH) currently indicates a bearish trend on the daily chart, as it is trading with the significance of the seller’s line (red) over the buyer’s signal line (green).
Support levels: $14 and $11.90
Resistance levels: $21.50 and $25.
Mr. Pratik chadhokar is an Indian Forex, Cryptocurrencies and Financial Market Advisor and analyst with a background in IT and Financial market Strategist. He specialises in market strategies and technical analysis and has spent over a year as a financial markets contributor and observer. He possesses strong technical analytical skills and is well known for his entertaining and informative analysis of the Financial markets.


