
 Home
Home News
News

- ETHW Price had been continuously falling with the lower lows, bearish candle formation and did not show any signs of trend reversal.
- MACD had generated a negative crossover whereas RSI at 29 oversold zone
Ethereum Pow price has been trading with mild bearish cues, while the bulls are struggling a lot to defend its recent lows at $2.821. As per coinglass, in the last 12 hours Long and short ratio stood at 0.93 which indicates sellers dominance are more as compared to buyers and price may stay bearish in coming days. Currently, ETHW/USDT is trading at $2.9549 with the intraday loss of 0.88% and 24 hour volume to market ratio 0.0353

Will the ETHW be able to attract buyers at lower levels ?
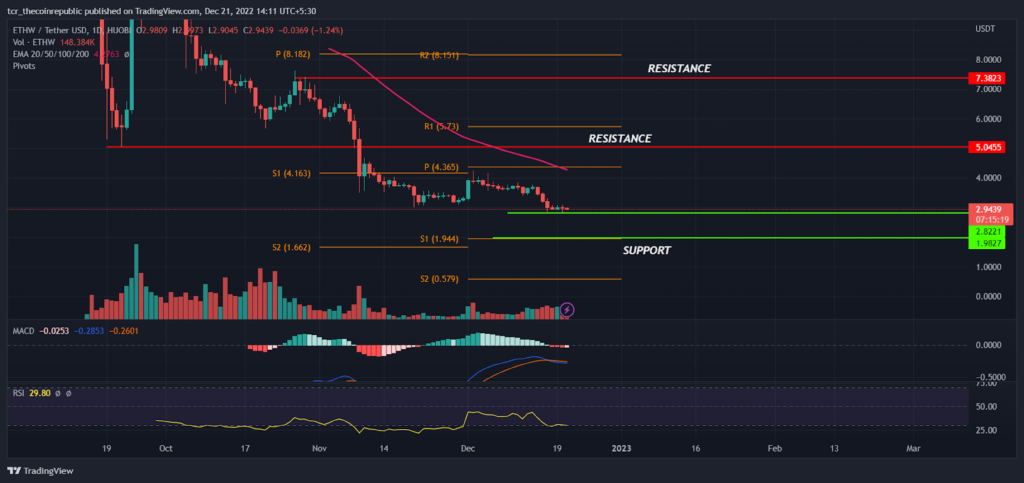
On a higher timeframe, ETHW has been in a strong downtrend and bears are continuously dominating on higher levels. In the mid of September, Buyers showed some strong bullish momentum and attempted to reverse the positional trend but unfortunately it resulted as a bull trap and sellers had massively shorted on higher levels. Currently, prices are consolidating near the support zone of $2.8000 and likely to see more weakness in coming days. The 50 day ema (pink) at $4.2675 will act as an immediate hurdle in coming days followed by the next hurdle at $5.0455.

The prices are trading below the monthly pivot level of $ 4.365 which indicates sellers dominance on higher levels and likely to drag prices down towards pivot S1 at $1.944. Meanwhile,The MACD has also generated negative crossover which denotes bearishness may continue in coming days whereas RSI at 29 indicates oversold zone and prices may witness a relief rally soon.
Will the ETHW break down the support zone ?
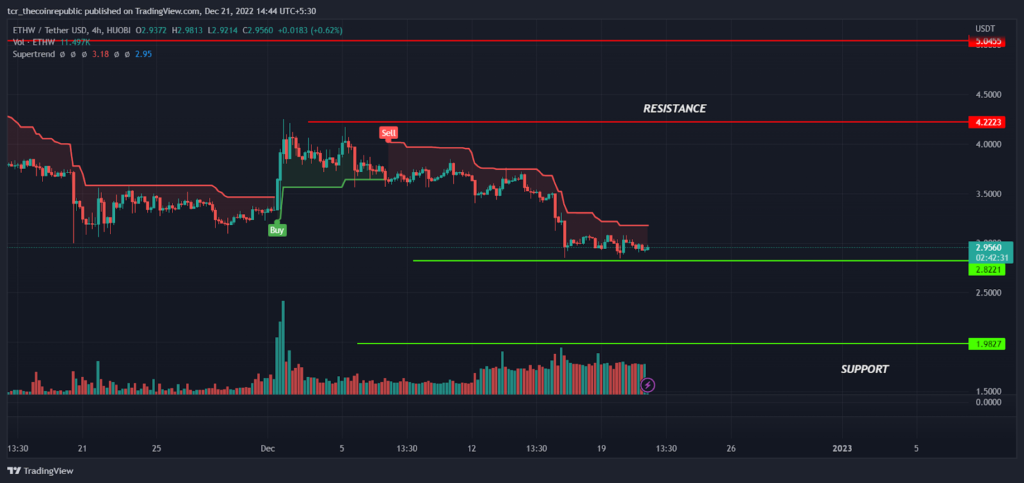
On a lower time frame, ETHW had been consolidating in the tight range between $2.8221 to $4.2223 and likely to breakdown soon. The super trend indicator has generated a sell signal which indicates the short term trend may remain in the bear’s grip and if bulls succeed to trade above $4.2223 we may see some upside trend reversal. On the lower side if prices slipped below $2.8221 bears may try to drag the prices further down towards $1.9827 and below levels.
Summary
EthereumPoW has been in a strong downtrend and bears are dominating on higher continuously dominating on higher levels. As per price analysis fresh buyers are still reluctant to buy at lower levels and technical indicators do not show any sign of trend reversal. So traders must avoid creating any buy positions at lower levels till the prices are trading below the resistance level of $4.2223.
Technical levels
Resistance levels : $4.2223 and $5.0455
Support levels : $1.9827 and $1.0000
Disclaimer
The views and opinions stated by the author, or any people named in this article, are for informational ideas only, and they do not establish financial, investment, or other advice. Investing in or trading crypto assets comes with a risk of financial loss.

Andrew is a blockchain developer who developed his interest in cryptocurrencies while pursuing his post-graduation major in blockchain development. He is a keen observer of details and shares his passion for writing, along with coding. His backend knowledge about blockchain helps him give a unique perspective to his writing skills, and a reliable craft at explaining the concepts such as blockchain programming, languages and token minting. He also frequently shares technical details and performance indicators of ICOs and IDOs.


