


As the pricing graph of ABBC coin reflects, it is on the significant bullish run from the starting of this month. The altcoin started the month with a price level of $0.09. As it gained bullish momentum in the market, it touched a high level of $0.13 in today’s market.
The current price is at the level of $0.13 with the market capitalization of $74,433,723 and volume traded of $38,884,827.
ABBC is Dubai based coin and venture which was established in late 2017 and aims to provide solutions that will change the way of online shopping and digital payments and make the interface secure and easy to use.
Recently, ABBC coin also got to listen to Bittrex which is one of the top crypto exchanges in the world. It allowed users to easily trade the ABBC coin in exchange for Bitcoin and Vice Versa.
The technical graph reflects on the current bullish movement of the altcoin with the help of the parabolic curve formed. The altcoin was having bullish momentum since December 2019 but faced major downfall due to the overall bearish momentum in the market during mid-February.
From the starting of this month, the coin again gained bullish movement and finally broke the crucial level of $0.10 again. Currently, it is at a bullish level of $0.13. The market capitalization is $74,433,723 with volume traded of $38,884,827.
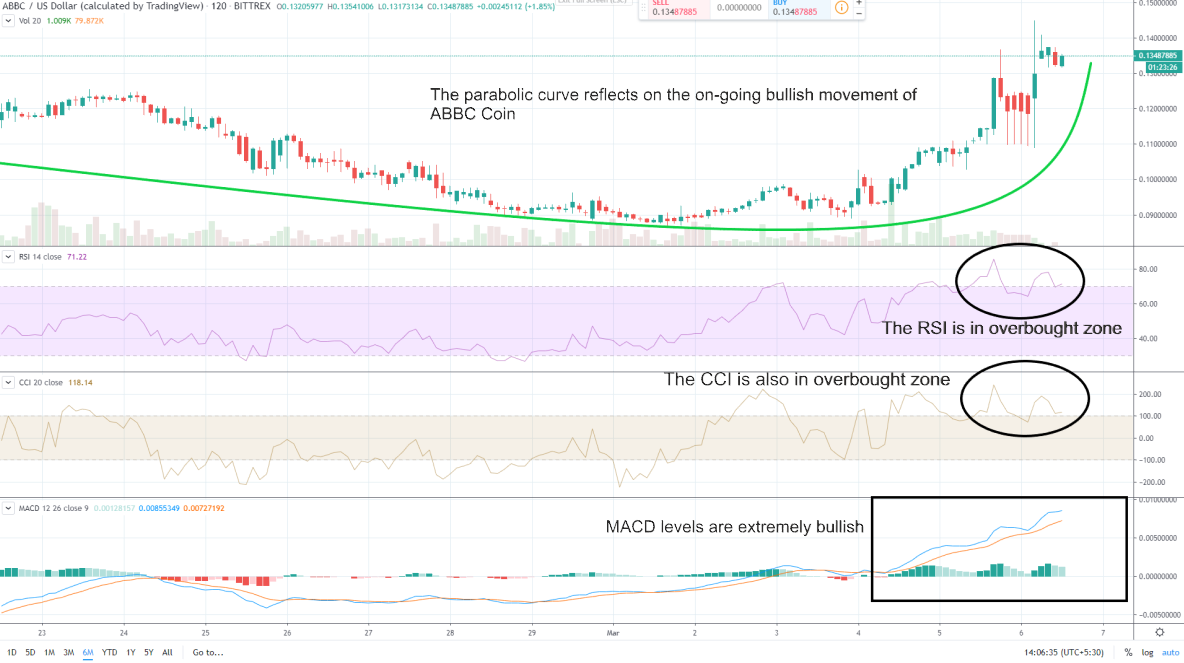
The technical indicators and oscillators suggest that due to the sharp rising rally the coin may face price corrections in upcoming days. If it breaks below the level of $0.10, it will indicate that bears are into play again.
The 24hour- RSI is in the overbought zone and making efforts to enter the normal regions with negative divergence. The current level of RSI is at the bullish level of 70.
The 24hour-CCI is also in the overbought region. A negative divergence to the normal region which helps the altcoin to maintain its stability over the price level of $0.010
MACD levels are being extremely bullish. It may face downtrend due to extreme bullish nature.
Resistance level: $0.17 and $0.19
Support level: $0.09


