
 Home
Home News
News

- This week saw the Bitcoin price falling below the $9,900 mark; volatility was evident as BTC hovered around the $10,000 mark.
- A wave of Defi boom which lifted the cryptocurrency market in July and August putting it in pole position, was short-lived.
- During this period, BTC has risen by 30% from 9,000 and exceeded the $12,000 integer mark multiple times.
Whether its Bitcoin or any other altcoin, the cryptocurrency market is remembered for its volatility. This week saw the Bitcoin price falling below the $9,900 mark; volatility was evident as BTC hovered around the $10,000 mark. However, in just a week, the entire cryptocurrency market turned upside down when bitcoin took a sudden drop from $12,000 to $10,000. While Bitcoin’s market was dropping in sync with global markets, the recent SUSHI sell-off by its creator added fuel to the fire.

The summer of 2020 has been a mixed one for the entire cryptocurrency market. Gold hit a record high, and U.S. stocks also recovered heavily under the raging epidemic environment. However, a wave of Defi boom which lifted the cryptocurrency market in July and August putting it in pole position, was short-lived. During this period, BTC has risen by 30% from 9,000 and exceeded the $12,000 integer mark multiple times. A large number of DeFi tokens have achieved a remarkable multifold increase, twenty times or even hundreds of times in just two months.

The cryptocurrency market turned bearish in late August, and the start of September, but it failed to bring bulls back. Experts claim that nothing is surprising in the timing of the current correction as September and bitcoin have long hated history.
Bitcoin Technical Analysis

Looking into the 4-hour chart, Bitcoin has reached an initially close area of interest but the major interest still remains around 9250 usd, at the moment bitcoin has formed a hidden bullish divergence. The expected relief bounce should start soon. Altcoins have already bounced a bit.
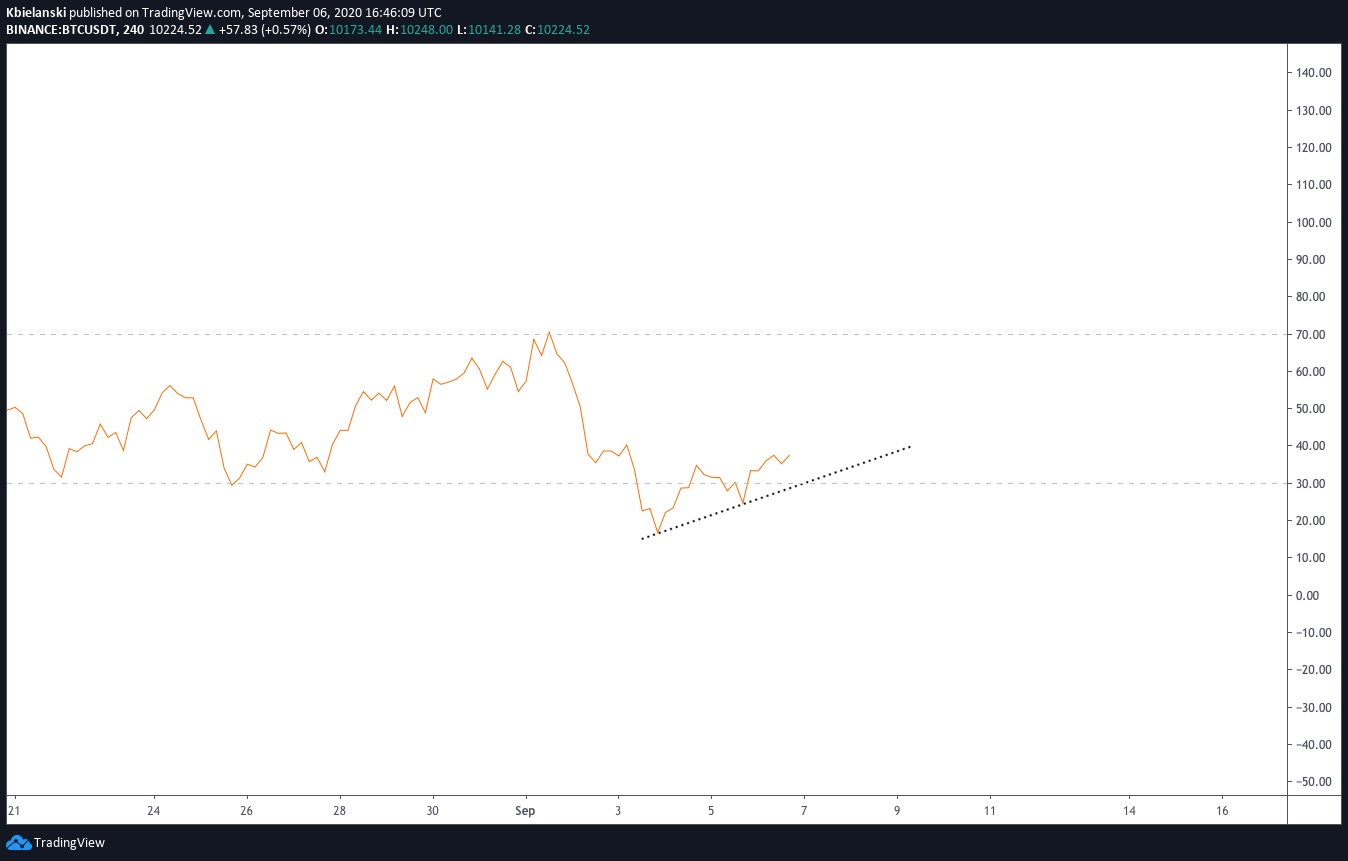
The Four-hour chart showed formation of hidden bullish divergence, which hints that in the coming weeks bitcoin could move and retest previous resistance.

The 12-hour chart shows clear resistance and support. This is a channel where the price will be moving in the following weeks.

On a weekly time frame, bitcoin will give more room for atlcoins to grow in the coming months but things should change around november that’s where we could possibly see a breakout from this channel. The interest level is 9250, Iit should eventually fill at least the CME cme gap.


