
 Home
Home News
News

- Bitcoin cash trading price breaks the multiple highs of previous trading sessions; however, it also tested the support level, but the overall momentum is still bullish
- The BCH/BTC pair is trading at 0.01358 BTC with an intraday gain of +0.67% after the double bottom breakout
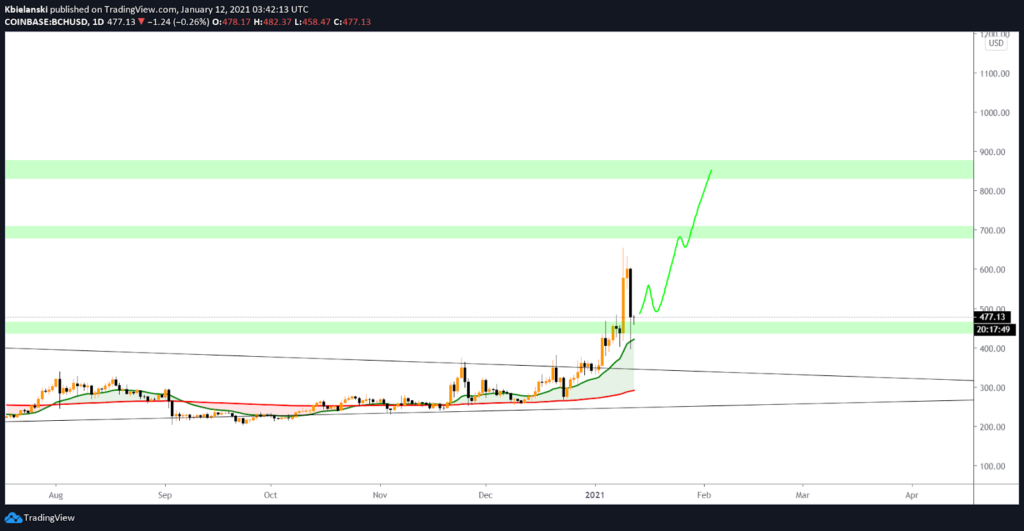
Bitcoin cash trading price testing the support level of $440 and $400 after a massive rally till $630. It is currently trading above 20-Exponential Moving Average(EMA), and we can expect some consolidation at the current price levels. The support is situated at the price levels of $440 and $380. Likewise, the key resistance on the higher side is placed at $520 and $620. The levels in upcoming trading sessions can be expected of $690 and $880.

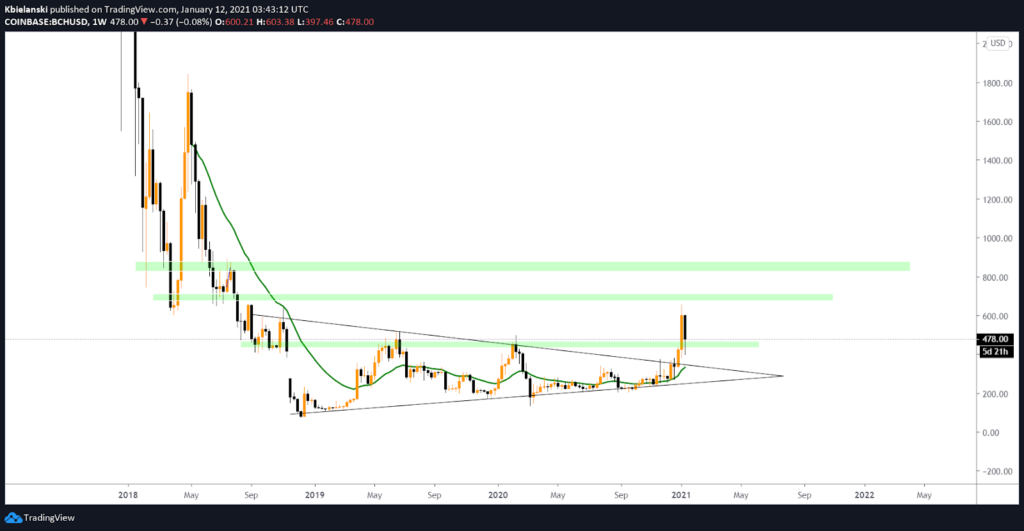
Bitcoin cash trading price on the weekly time frame is given a positive breakout from the symmetrical triangle pattern, and now the resistance line is converted into the support line. The positive crossover of 20-EMA over 50-EMA generates a bullish momentum for the coming trading sessions. The daily chart support for BCH is placed at $440 and $400, similarly resistance levels at $520. The volume recorded in the last 24-hour session is $12,445,133,158, and drops over -27.70%, with the total market capitalization standing at $8,991,200,537, which drops by -2.95% in the last 24-hour. BCH over the past seven days, gains over +13.75%.

The Relative Strength Index (RSI) indicates a bullish momentum while trading at 58.62, which is placed near overbought territory. Therefore, it can expect a short-term retracement in upcoming trading sessions.
Moving Average Convergence Divergence (MACD) currently indicates a bullish trend on the medium-term chart as it gives a positive crossover. The significance of the selling line (red) over buying signal lines (green)is high. However, a negative crossover is expected as both lines are heading closer to each other.
Support levels: $440 and $380.
Resistance levels: $520 and $620


