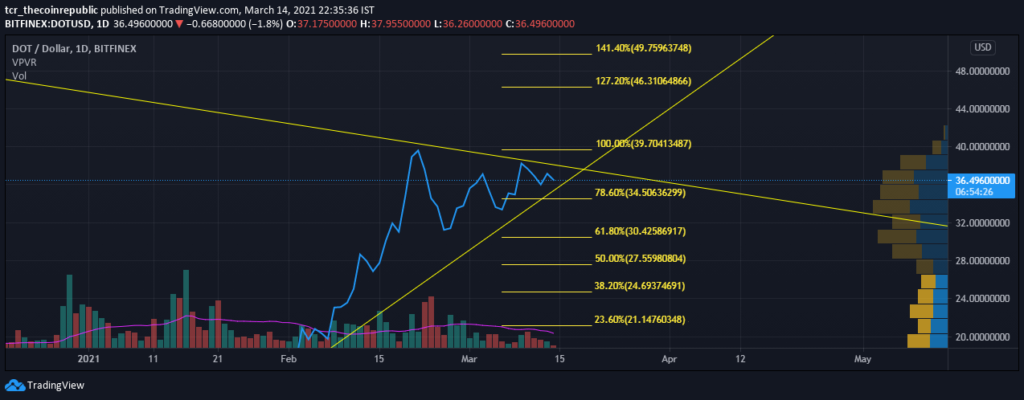
- Polkadot price has reached the vertex of an ascending triangle formed out of diagonal support and a horizontal resistance
- Polkadot price consolidated due to equated buying and selling volumes

Polkadot price has made an ascending triangle with diagonal medium-term support and a short-term resistance. The price has reached the vertex and shows indecisiveness amongst the participants as the volumes have declined significantly and the price range gas equated buying and selling volume, indicating a deadlock between the buyers and sellers. The market cap and 24-hour volume are $33,599,253,505 and $1,772,773,868 respectively.
Polkadot Price In Consolidation Or Distribution Phase?

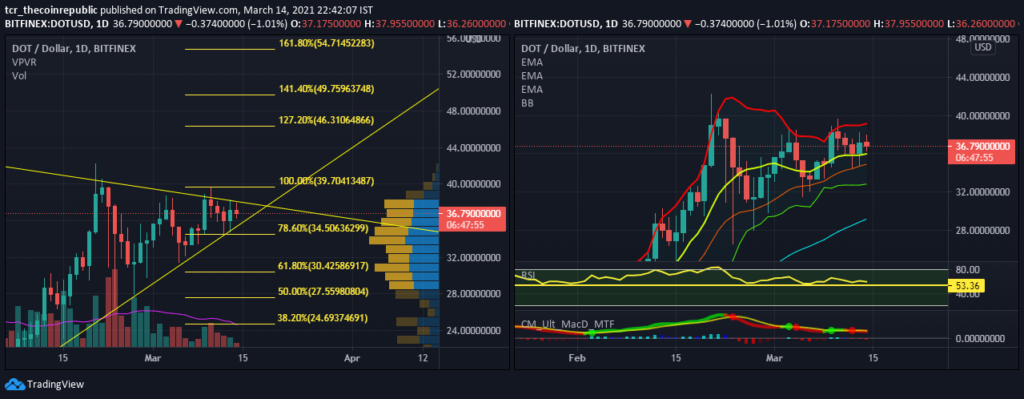
Left Image: The candlestick chart of the daily time frame shows that the price has consolidated at the fore-said triangle’s vertex. However, it’s not just the diagonal supports and resistance but also the 100% and 78.6% Fibonacci levels that restricted the price between $39.7 and $34.5. One needs to look after a breach of the Fibonacci levels to confirm breakout or breakdown and take the swing, respectively. Secondary support and resistance are $30(61.8% Fibonacci level) and $46.3(127.2% Fibonacci level)
Right Image: The price is above the 10-EMA($36), 20-EMA($35), 50-EMA($29.17), and 200-EMA($12.185); an indication of an uptrend; however one needs to wary of possible breakdown from 20-EMA, which can reverse the trend in the short term.
Bollinger Bands indicates sideways trends so far, as both the bands are sideways. The bands act as resistance and support at $39 and $32.83, while the median 10-EMA supports the price at $36.
RSI is creeping between 50-60 levels, suggesting a mild bullish momentum, but at this junction, a breakdown of RSI below 50 may reverse the trend, while a breach above 60 levels can trigger a bull rally.
MACD(8,21,5) is sideways with the signal line and slow line overlapping each other; this happens due to consolidation. If the MACD triggers a buy or sell signal now, it is likely to be a true one and may push the coin in the respective directions.
Conclusion
Polkadot price is forming an ascending triangle accompanied by neutral MACD and RSI and low volumes. This formation is indicating a possibility of considerable movements on either side.
Support: $34.5(78.6% Fibonacci levels) and $30(61.8% Fibonacci level)
Resistance: $39.7(100% retracement) and $46.31(127.2% fibonacci level)


 Home
Home News
News


