
 Home
Home News
News
- Bitcoin price declined by $7,000 from its last high of $61,000 before receiving support from a diagonal support
- Bitcoin price may resume the upward journey, volume yet to confirm
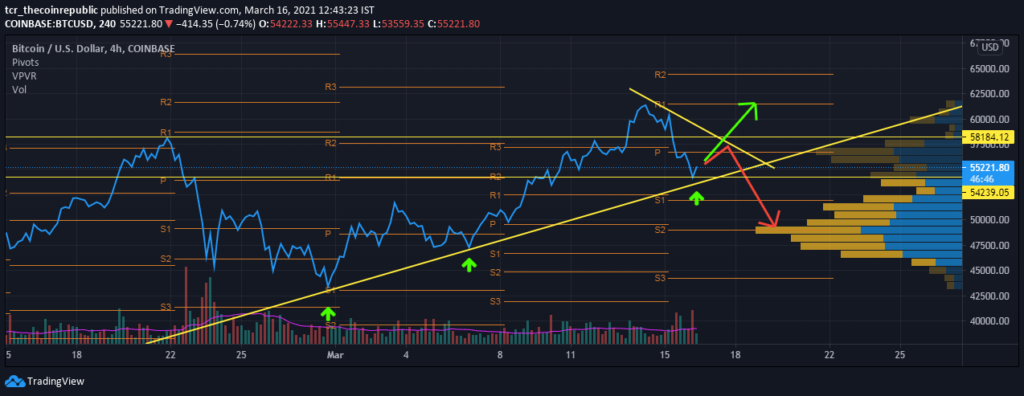
After a decline of $7,000, Bitcoin price showed a sign of resuming the upward trend when it touched the $53,000 levels, where old pivot levels and diagonal support are clustered. The volume analysis shows a face-off between the bulls and bears, as the price range has equal buyers and sellers. The current 4-hour session hasn’t given a confirmed reversal, as the volumes remain low. The market cap and 24-hour volumes are $1,031,523,904,282 and $70,693,830,550 respectively.
Bull-Bear Tussle Over Bitcoin Price
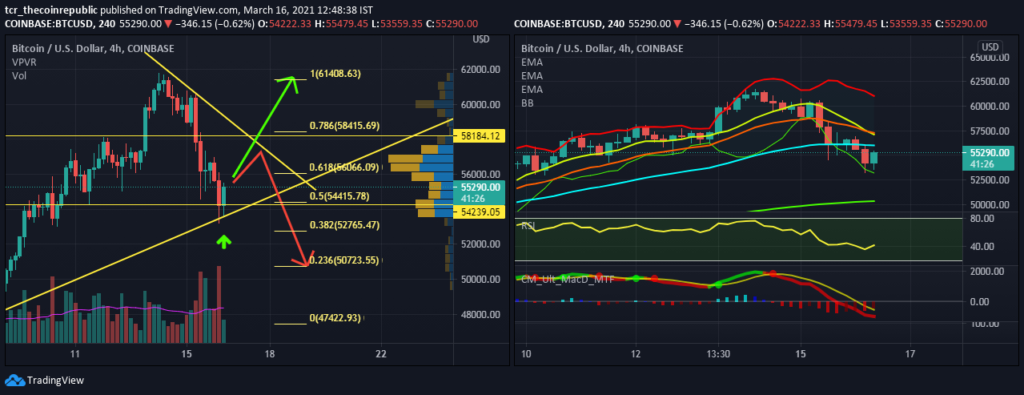
Left Image: In the 4-hour time frame, bitcoin touched-down over a diagonal support and indicated a support zone present along $53,000-$54,500, by forming a tweezer bottom pattern . Supports are found along $54,400(50% retracement), 38.2% retracement at $52750 and $50,750(23.6% retracement). Resistances are found along $56,000 (61.8% retracement) and $58,400(78.6% retracement).
Right Image: The EMAs indicate a bearish momentum; the 10-EMA, 20-EMA, and 50-EMA are acting as resistance at $57100, $57,200, and $56000 levels. The 200-EMA remains crucial support at $50,000.
Bollinger Band indicates are declining, which projects an one-sided momentum towards South. The bands are restricting the price between $53,000 and $61,000. If the price bounces back after taking support from the lower band, resistance remains $57,000, i.e.10-EMA(median).
RSI at 40, suggesting a bearish momentum; however, the recent 4-hour session diverted the RSI up, which can initiate a reversal. Also, 35 zones remain a crucial support level for this asset’s indicator, hence a possible reversal in progress.
MACD also signs of reversal after indicating convergence initiation, which can trigger a buy signal for the bulls.
Conclusion
Bitcoin price has received support at $53,000, a cluster of pivot levels and 50% retracement. The coin is making a tweezer pattern which is a reversal pattern along with RSI and MACD, indicating a pull-back in the downward journey. However, two situations might arise, Bitcoin might test support and plummet again or else break out of the resistance and head toward the previous high at $61,000.
Support: $54,400(50% retracement), $52750(23.6% retracement) and $50,750(05 retracement).
Resistance: $56,000(61.8% retracement), $58400(78.6% retracement) and $61,000(100% retracement)


