
 Home
Home News
News
- RUNE escalated from a low of $9.13 to a high of $11.80 in Wednesday’s intraday session
- The RUNE/BTC pair is trailing at 0.0002865 with a gain of 10.35% at press time
- The current price of RUNE is $10.88 established on the back of a 10.88% increase in the last 24 hours
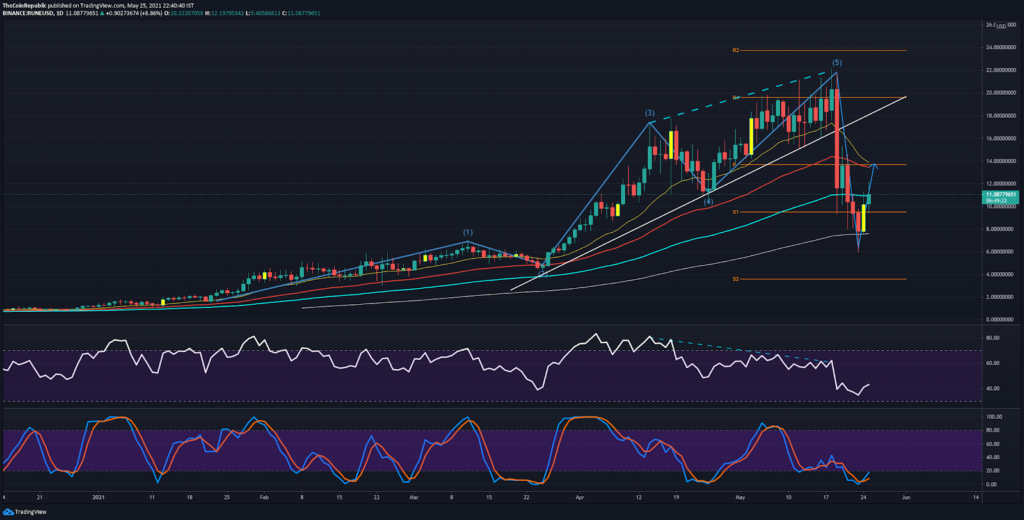
The bloodbath that caused RUNE to wipe off half its value after the establishment of a fresh ATH was a consequence of bearish divergence.
The massive corrective wave was anticipated on account of the price action being wrapped inside the Elliot Wave Pattern.
While an enormous red candlestick smashed right through the extended support trend line, the 200 EMA dived to provide strong support to the token.
Amidst the general market rectification cycle, RUNE plummeted by 40% in a matter of two intraday sessions. The bulls succeeded in today’s session and managed to re-inspect the pivotal support of $9.52.
At present, the price action is sandwiched between the 100 and 200 EMA. The fact that the bulls have stepped up as evidenced by bullish engulfing will cast an uptrend for the upcoming sessions.
According to pivot points, the next key resistance is placed at $13.69. A breach of that particular level will invalidate a bearish crossover between the 20 and 100 EMA.
RUNE/USD on the 4-hour chart
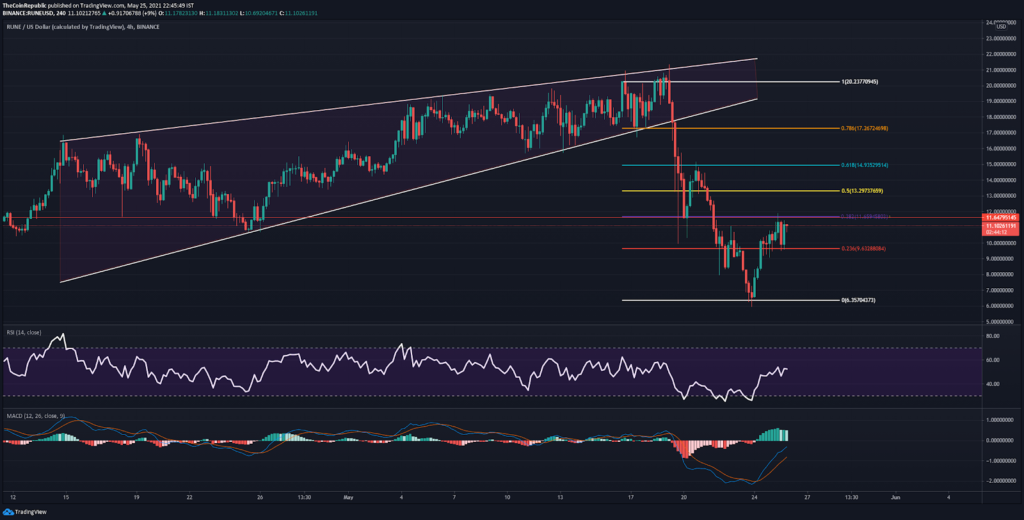
The 4-hour chart of RUNE forecasts an accumulation phase. The token dodged the bearish 0.032 retracement and overturned that level into support by continuously retesting in today’s session.
The next barrier for RUNE is the resistance of $11.65(FIB 0.382) which is in confluence with the prolonged resistance line. A decisive close above this level could lay the ground for a 35% upswing.
The 4-hour chart also highlights the fact that RUNE was successful in defending the 20 EMA.
On the downside, the failure of the price to sustain above $9.6 could paint a bearish scenario for RUNE.
The Relative Strength Index projects a neutral momentum with no signals of divergence ahead.
The Moving Average Convergence Divergence (MACD) is suggesting a continuation of the bullish outlook as demonstrated by the histogram in the positive territory.
CONCLUSION: RUNE discovered a quick recovery after a massive fall that wiped off half of its gains. Just today, the super trend indicator flashed a buy signal on the 4-hour chart. RUNE is currently hovering in phase two of the Elliot wave pattern. While a temporary bullish reversal is imminent, a rejection from $13.69 could validate a bearish outlook.
Investments in cryptocurrencies are subjected to market risks, investors should conduct their due diligence before investing.
SUPPORT : $9.52,
RESISTANCE : $11.65, $13.69

Nancy J. Allen is a crypto enthusiast, with a major in macroeconomics and minor in business statistics. She believes that cryptocurrencies inspire people to be their own banks, and step aside from traditional monetary exchange systems. She is also intrigued by blockchain technology and its functioning. She frequently researches, and posts content on the top altcoins, their theoretical working principles and technical price predictions.


