
 Home
Home News
News

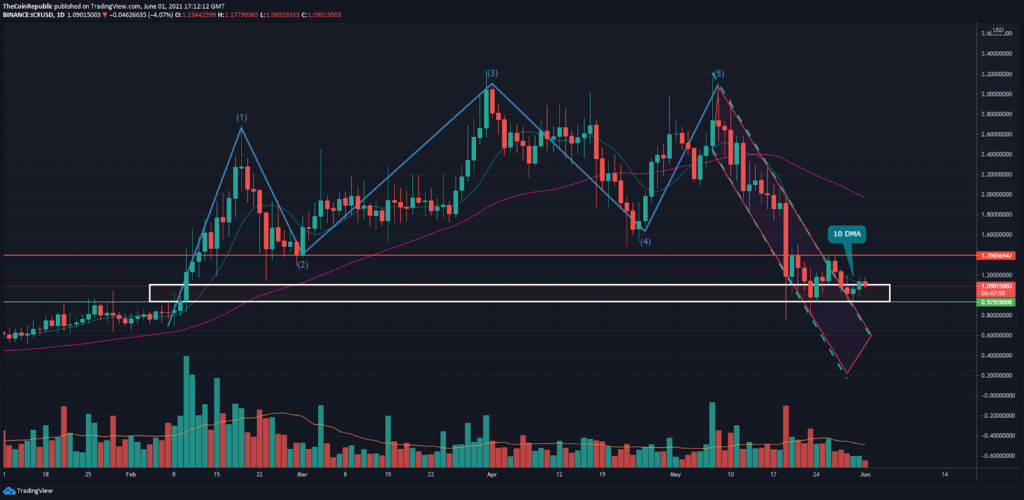
- ICON price is facing dynamic resistance by the 10 DMA on the daily chart
- ICX continues its bearish bias by diminishing from a high of $1.16 to a low of $1.07 in Tuesday’s intraday session
- The ICX/BTC pair is trading at 0.00003044 BTC with a loss of 1.95% at press time
The daily technical chart of ICON projects the beginning of a corrective wave. Currently sitting at a low of 66% from its ATH, ICX has been vulnerable to the bears since May 7th.

The bearish bias resulted in the price action getting restricted inside the descending parallel channel. Only recently, ICX was successful in breaking out of the bearish continuation pattern and re-inspecting the trend line as support.

As per pivot points, a strong support cushion is placed at $0.92 which is also bolstered by the demand pit. ICX re-explored the critical zone nearly two days back and intends to accomplish gains worth 27% as a consequence of a bullish reversal from the demand zone.
The volume of (1.27 M) is extensively below the volume MA (4.41 M) of 20 days. The trading volume data allows accessing the overall strength of the trend that plays a decisive role in price changes.
While the weekly Stochastic RSI has successfully transpired a bullish cross, the 10 DMA on the daily chart is invalidating the efforts of the bulls to plummet the price back up.
The current price of ICX is $1.11 established on the back of a 0.20% decrease in the past 24 hours. In the past month, the price of ICON has decreased by 57.38%, its accomplishments on the 1-year time frame amount to 227.87%.
ICON Price chart on the 4-hour time frame
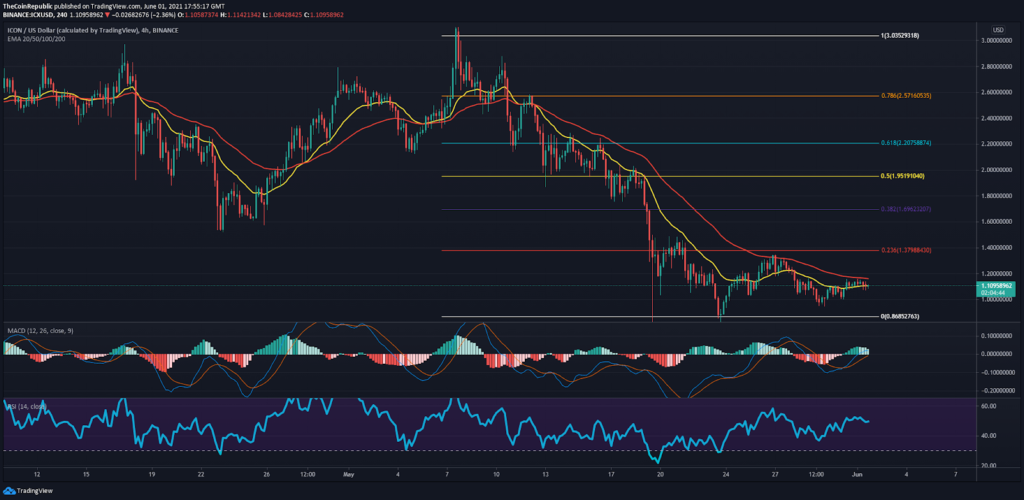
ICX, like the rest of the market, is joined at the hip of Bitcoin’s price action. This explains the sluggish movement of ICX on the 4-hour chart.
At present ICX price is hovering exactly between FIB 0 and bearish FIB 0.236 retracement. Although the current trend is exhibiting exhaustion, ICX still stands at a high of 27% since the destructive fall.
For the bulls to enforce greater recovery, the price has to overcome the bearish FIB 0.0236 retracement at $1.37. While the target lies at an elevation of 24% from the current price, a bullish crossover between the 20 and the 50 will act as a catalyst in driving the price back up.
The technical indicators are devising a sell signal as evidenced by the Moving Averages which are trading above the trend in all time frames.
The Moving Average Convergence Divergence (MACD) is disclosing weakness as demonstrated by the diminishing histogram at press time.
The Relative Strength Index (RSI) on the other hand is lingering exactly inside the equilibrium zone in the range of 50. Along with that, the Crypto Volatility Index (CVIX) is currently flashing its highest value of 87. A relatively higher CVIX means traders should brace themselves for significant price fluctuations. The most basic approach to use CVIX while trading in cryptocurrencies is to set the buy triggers when the volatility goes overboard.
CONCLUSION: While the price of ICON lies at the emergence of the major impulsive wave, its short-term movements lie in the hands of Bitcoin. If Bitcoin embarks on another bull run, ICX will follow its footsteps and witness substantial gains.
Investments in altcoins are subjected to market risks and bitcoin dominance. Investors should conduct due diligence before investing,
SUPPORT : $0.92
RESISTANCE: $1.14, $1.37

Nancy J. Allen is a crypto enthusiast, with a major in macroeconomics and minor in business statistics. She believes that cryptocurrencies inspire people to be their own banks, and step aside from traditional monetary exchange systems. She is also intrigued by blockchain technology and its functioning. She frequently researches, and posts content on the top altcoins, their theoretical working principles and technical price predictions.


