
 Home
Home News
News
- When the demand equals the supply, support is formed
- Resistance is formed when the supply exceeds the demand
- Recognizing support and resistance during consolidation phases the key to successful crypto trading
Crypto Trading, by definition, is the process of buying an asset at a lower price and selling it at a higher value. Many investors find crypto trading complex; however, going by the barest minimum, some strategies can help become a successful crypto trader. One of the best strategies is to understand the asset’s support and resistance levels.
Once a crypto trader can identify the support and resistance levels of any cryptocoin, they can time their entry and exit timing in the market and achieve success.
Understanding supports
When the demand equals the supply, support is formed. The bullish traders tend to buy because the price seems attractive enough, and the chances of it falling lower are slim. The bears in the market also stop selling because the market has fallen sufficiently, and the chances of rebound are high. Both scenarios are a perfect setting for support.
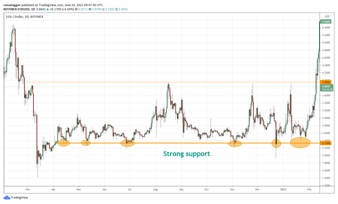
The above chart shows the support phase of EOS. Every time the price falls to the $2.33 level, buyers emerge, and the selling drops. A rebound is produced because demands exceed supply.
Horizontal supports are perceived to be more reliable; they are not the only way support is formed. An upward surge trend lines act as supports.
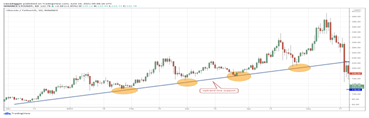
Litecoin(LTC) started its surge in December 2020. Later, LTC prices rebounded on many occasions off the trendline. Such a situation happened because as soon as the price touched, the trendline bulls started believing that the LTC/USDT pair had reached their best levels. At the same time, the sellers also stopped selling, assuming that the near-term may be oversold. Both the factors occurring at the same time caused the correction to end and the uptrend to resume.
Understanding resistance levels
Resistance can be defined as the opposite of support since the supply exceeds the demand. It puts a brake on the upward surge. Buyers who purchased the assets at a lower price start to rake in profits, and the aggressive bears start shorting as they believe the rally is extended and ready for a pullback. Thus the supply exceeds the demand, and the graph plunges.
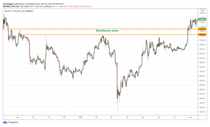
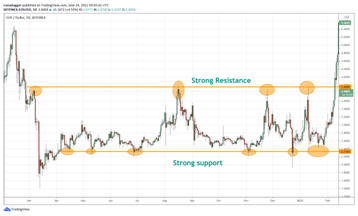
The support or the resistance do not need to be in a straight line. The chart above reveals that the zone between $10,500 to $11,000 acted as the resistance zone. Whenever the prices touched the resistance levels, short-term investors booked profits, and aggressive bears shorted the BTC/USDT pair. The chart reveals that on five occasions, the pair touched the resistance zone and retreated.
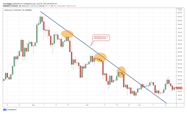
Ether(ETH) was in a free-fall stage from May 6, 2018, to July 4, 2018, rallied to the resistance line but turned down from there. Investors having a bearish sentiment used the rallies to start new short positions as they anticipated lower levels.
At the same time, the bullish investors that were buying on the sharp dips ended their buying spree near the resistance line. Hence, the bar acted as a wall, and the price turned down from it.
Sniffing out support and resistance during consolidation phases
Once the support and the resistance levels are restricted, as seen in the chart above, investors can buy at the start of the rebound and then wait for the price to rally up to the resistance point to sell and close the position. The stop-loss for the trade is kept just below the support line of the range.
At times experienced investors sniff out these stops by pulling the price below the support of the range. Therefore investors sometimes wait for the price to fall below the support before dumping their positions.
Supports in an uptrend
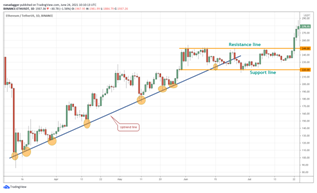
Whenever a crypto asset takes support on an uptrend three times, the investor can rest assured the line will hold. Hence investors can take long positions on the bounce off the trend line. The stops can be adjusted just below the trend line. However, one thing to note in an upward trendline is a fall does not necessarily mean that the trendline is breaking, as is illustrated in the chart above.
However, in an uptrend, the break below the trendline does not necessarily mean that the trend has reversed. Many times, the trend takes a break before resuming again. The ETH/USDT pair moved steadily on the trendline until it broke below the uptrend line. However, it did not start a new downtrend, and the price consolidated in a range for a few days before resuming the up-move. However, if the value falls below the upward trend line for some time, new short positions should be avoided.

With a background in journalism, Ritika Sharma has worked with many reputed media firms focusing on general news such as politics and crime. She joined The Coin Republic as a reporter for crypto, and found a great passion for cryptocurrency, Web3, NFTs and other digital assets. She spends a lot of time researching and delving deeper into these concepts around the clock, and is a strong advocate for women in STEM.


