
 Home
Home News
News
- MIOTA coin shows a bullish crossover of the 50 and 100-day EMAs
- The MIOTA/BTC pair was trading at 0.00003652 BTC with a gain of 4.91%
- The 24hr trading volume for the MIOTA coin is $277.4 Million
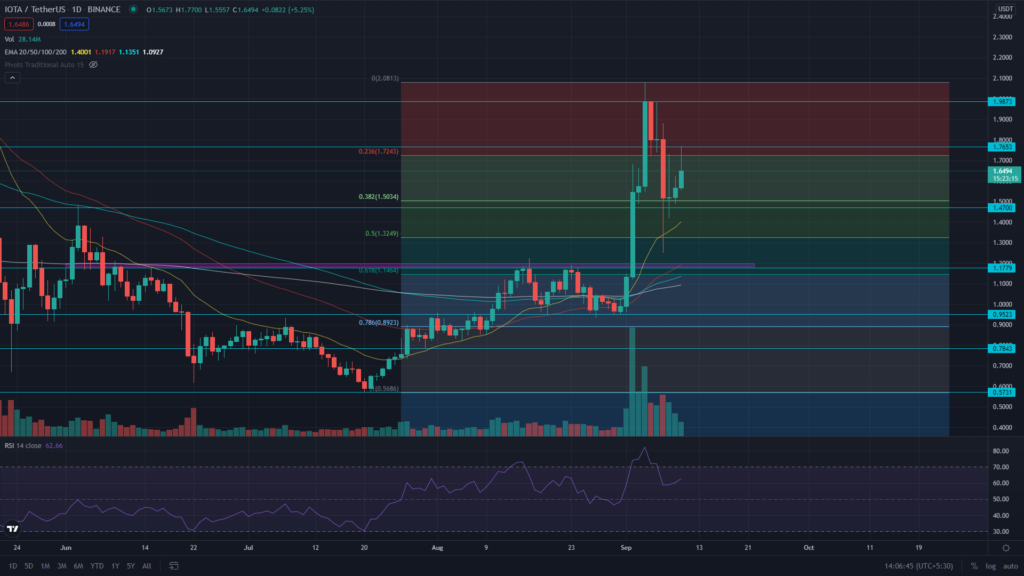
On 7th September, the MIOTA can showcased a 15% drop, the same as almost all coins of the Crypto market. However, MIOTA still managed to sustain above the crucial support of the $1.5 mark, which coincides with the 0.382 FIB level. Anyhow, the coin currently displays a better chance of reversal with the formation of a bullish morning star pattern at this level.
The EMA’s indicates a bullish trend for MIOTA price is trading higher than the critical EMA’s 20, 50, 100, and 200. The chart also shows that there could be a bullish crossover between the 20 and 100 EMAs, which will attract more buyers to this market.
The RSI (BULLISH) current value is 62, indicating a bullish sentiment in the MIOTA coin.
MIOTA Coin Crypto Chart In The hourly Time Frame
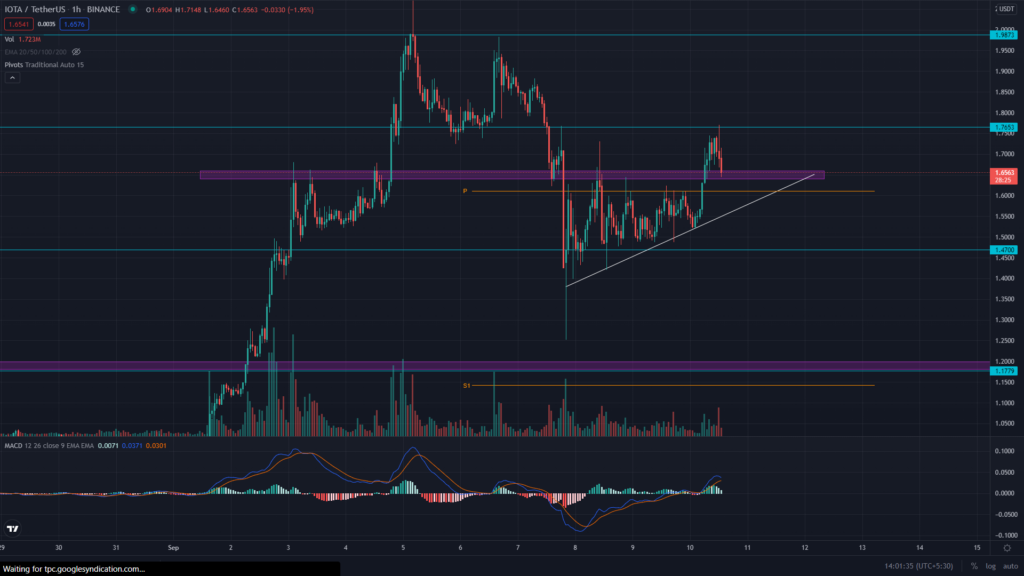
The MIOTA token shows the formation of an ascending triangle pattern in the hourly time frame. The crucial level(neckline) for this pattern is at the $1.6 mark. The coin price provided an excellent opportunity for its traders with a decisive breakout from this level. However, the price is currently giving a retest to this level.
The moving average convergence/divergence indicator (BULLISH) provides an excellent confirmation for the above pattern as both the MACD signal lines have crossed above the neutral zone(0.00).
Conclusion: The technical view of the MIOTA coin price suggests a bullish outlook. The indicator and price action are both positive, which is good news for trend traders looking for long-term opportunities in the Crypto market.
As mentioned above, The coin price gave a breakout from an ascending triangle pattern. If the price manages to sustain above the breakout level, the Crypto traders can expect a target till the $2 mark.
Support: $1.6
Resistance: $2


