
 Home
Home News
News
- Veteran Trader Peter Brandt has pointed out the unusual patterns that show the market condition of Bitcoin and Ethereum.
- A few days ago, Brandt called out “Bitcoin Hodlers” and said it is of no use to hold the world’s largest crypto assets for an extended period.
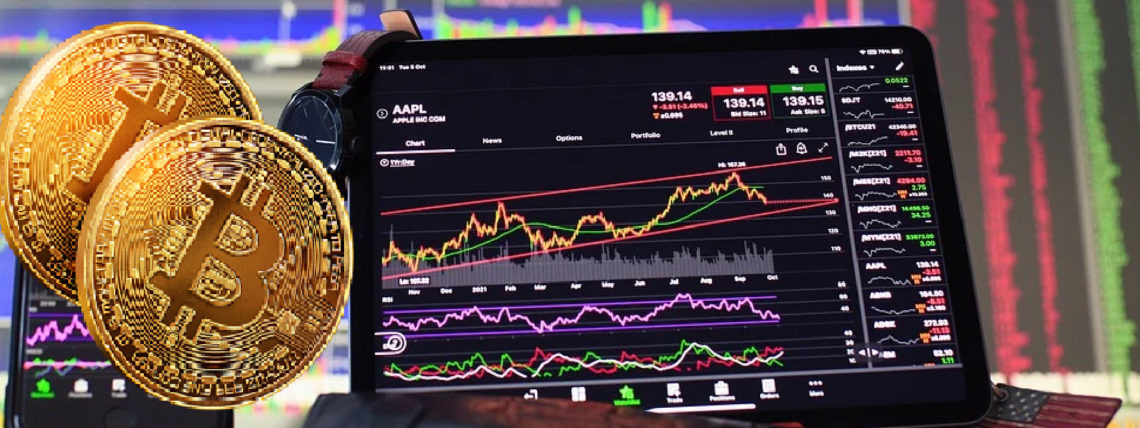
- The data from TradingView shows both the assets are moving in the symmetrical pattern as mentioned by Brandt.
Peter Brandt is one of the most famous traders in the crypto industry and holds over 47 years of experience. In his latest tweet, Brandt has highlighted the unusual pattern that would reflect the ongoing market condition for Bitcoin and Ethereum.

As reported earlier, a few days ago, the Veteran trader in another tweet said that it is of no use to hold the flagship cryptocurrency for a longer period, referring to “Bitcoin hodlers.” In the same tweet, Brandt added that he is not interested in making the same money.

He also predicted that the world’s leading cryptocurrency by market cap needs to rise by 400% in order to recover from an 80% drawdown completely.
In his recent tweet, Brandt explains that he believes Ethereum is currently forming a symmetrical triangle pattern, which mirrors the fact that the market is confused. Instead of changing its direction to either side, it will probably continue to move forward.
Only if the fifth touching point appears to be inside the symmetrical formation, the price of the second-largest cryptocurrency can explode. After the rise in trading volume, the reversal is expected to follow, which is likely to bring buying power.
Brandt also shared the same pattern on Bitcoin before pointing out the formation on the Ethereum chart. Brandt called the flagship currency less reliable since it is difficult to predict the movement of the assets before a breakout.
The symmetrical patterns are proven to be successful in case of a breakout. Once the price of the assets breaks through the upper border of a pattern, the pattern is considered finished, and afterward, it shoots up, forming a consolidation range above the range-bound.
What Does The Chart Performance Of Bitcoin and Ethereum Tell?
As per the data from TradingView, both the leading digital assets are moving in the symmetrical pattern as mentioned by Brandt. The flagship currency touched the border of the triangle and has not yet been able to climb back.
The second-leading cryptocurrency, Ethereum, also reached the border but dropped below it and is now trading at the lowest volume observed in the past 30 days. At the time of writing, the price of Bitcoin stands at $38,189.65, while Ethereum is $2,533.99.
ALSO READ: Price Prediction 07/03: Bitcoin (BTC), Ethereum (ETH), Ripple (XRP), Terra (RUNE), Solana (SOL)

Andrew is a blockchain developer who developed his interest in cryptocurrencies while pursuing his post-graduation major in blockchain development. He is a keen observer of details and shares his passion for writing, along with coding. His backend knowledge about blockchain helps him give a unique perspective to his writing skills, and a reliable craft at explaining the concepts such as blockchain programming, languages and token minting. He also frequently shares technical details and performance indicators of ICOs and IDOs.


