
 Home
Home News
News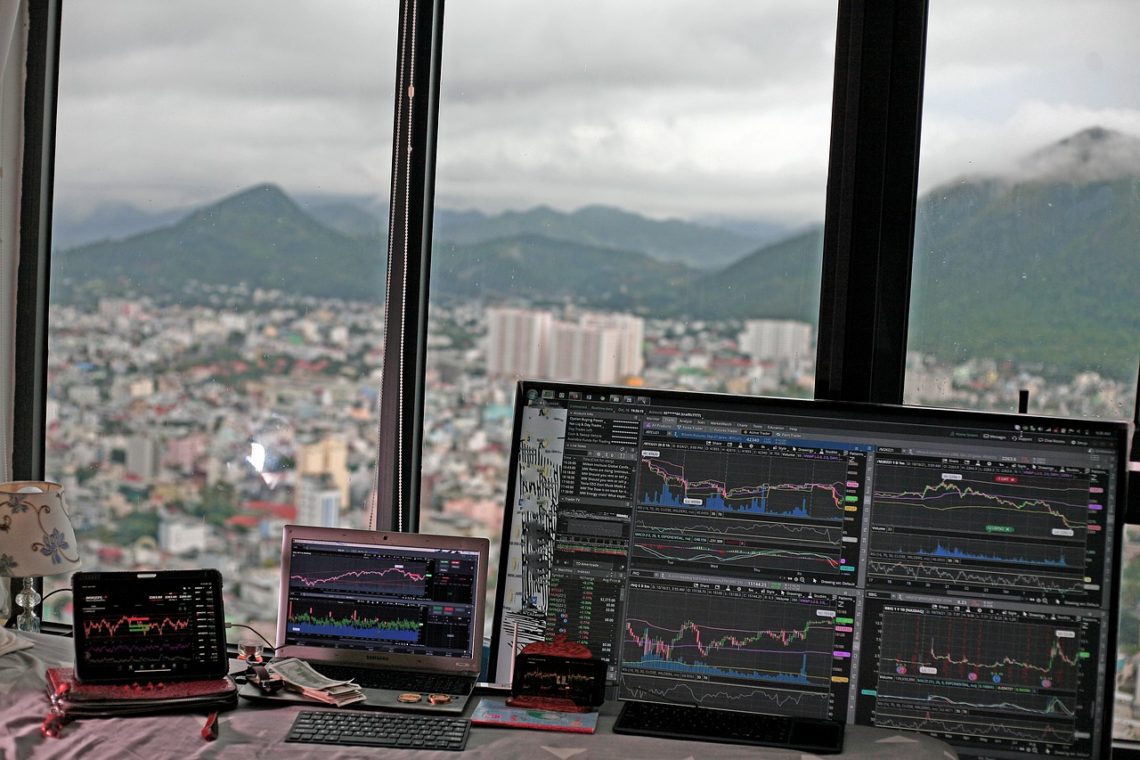

Crypto market has grown exponentially over the past few years. Following the spikes in the market, many began to look for the true potential of these assets. Looking at such potential projects in their nascent stage, many are willing to step into the ecosystem and pour some money. But to be able to make gains from the market, investors and traders do need to learn how to read charts. Understanding the technical analysis and terminologies might be scary a bit for novices but will significantly help.
Have you joined the crypto boom yet?
To begin with, in crypto trading, the first and essential step is to learn how to read the charts and should undertake a competent technical analysis based on the Dow Theory. Notably, the Dow Theory is based on some principles.
When it comes to price, we know that the cost of cryptocurrencies is set in accordance with the demand and supply law. But essentially, the price depends on everything, including various variables. Such variables include the present, past, and future requirements and restrictions that may affect. More than market circumstances, the price behavior depends on market analysis.
Adopting every new information, the asset’s price adjusts to reflect the information.
Furthermore, history tends to repeat itself. Hence many veterans do follow the historical behavior to estimate the coming trends.
Interpretation of charts digital currency charts
Interpretation of crypto charts is the first essential step, to begin with. There are many tutorials available on the internet that can help learn how to understand the different types of charts and speak the history looking at those charts.
The candlestick charts for digital assets are the most popular ones that almost every trader uses. Notably, the chart itself speaks of every movement of the prices with the help of boxes and whiskers. Following the candles on the chart, investors can know about an asset’s price changes over a specific period. Each candle also shows the opening and closing prices. Besides, the shadows of each candle represent how high and low these rising and falling prices have climbed or fallen.
Meanwhile, bullish and bearish candlesticks reflect whether the market sentiment is sloping or gaining momentum through green and red candles.
Directions of market movement
It is worth noting that the markets move in three different directions.
Notably, the primary movement is referred to as a vast trend that can continue anywhere from a year to many years.
The secondary one is also known as the intermediate movement, which underscores what happens over a medium period which might range from 10 days to three months. Notably, the trends in the middle direction are calculated while considering some significant price fluctuations.
And the last one, known as the short-swing, refers to a market’s modest change that lasts only a few days.
Phases of the market
The crypto market has three phases: the accumulation phase, the public involvement phase, and the distribution phase.
In the accumulation phase, the investors begin to acquire or sell the coin against the market’s common opinion. The public involvement phase, which is also known as the absorption phase, is when the public begins to participate following veterans. And at the end, following the hypothesis of the absorption phase, the distribution phase occurs.
It is significant to note that experienced traders or investors begin to redistribute their holdings in the last phase.
Crucial tools for analyzing a pattern
Analyzing the crypto candlestick patterns is genuinely significant as those help us to know when to enter and exit. Using the Relative Strength Index (RSI), investors can calculate the speed and strength of the crypto market’s price movement by comparing the current price to its prior performance.
Suppose the RSI of a particular coin crosses 70, the tool signals overboughtness. In contrast, if the RSI goes below 30, it is deemed that the asset’s price is cheap.
On the other hand, we have support and resistance. The most vital levels that help an investor to enter or exit. Commonly, the traders or investors in the cryptocurrency market purchase the digital assets at the support levels and sell at the resistance levels.
According to some experienced analysts, the support level is formed when the cryptocurrency’s price stops plunging after crossing a particular barrier. If the sellers maintain their momentum, the price of the digital currency could potentially break through the last support levels and construct a new one.
Simultaneously, a resistance level is produced when the cryptocurrency price halts growing. If the digital currency buyers gain enough momentum, the resistance level could potentially be broken.
Whatever is explained above is just a brief introduction. To become a serious investor or trader, chart reading is very vital. It is not that anyone would be able to become an advanced trader or a veteran investor with just some technical knowledge. While knowing to read charts, it is also essential to follow some fundamentals. If you are stepping into the digital financial market, then do note what’s happening in the ecosystem. How different news and updates are impacting the prices. And then implement your fundamental skills after learning how to read crypto charts.
Although digital currency is heavily volatile in nature, it brings enormous opportunities. If someone is not interested in investing in such a volatile market, then they should at least figure out some potential projects and support for the long term. Indeed, cryptocurrencies are going to be the future, and we cannot ignore the industry with such enormous potential.


