
 Home
Home News
News
- Synthetix price is consolidating inside a range-bound area over the daily chart.
- The crypto asset falters at 20 SMA and is trading below 50, 100 and 200-days Daily Moving Average.
- The pair of SNX/BTC is at 0.00009284 BTC with an intraday drop of 2.05%.
Synthetix price has been sideways inside a range-bound area over the daily chart. The token tried to escape the range and head towards the distribution level, but accumulation was not upto the mark, and SNX failed to break out of the consolidation phase. SNX coin price must gain a strong accumulation of buyers and should march towards the distribution level to register its escape. The game between buyers and sellers continues as the token falters to gain either of the constant momentum. SNX investors need to wait for any directional change over the daily chart.
Synthetix price is presently CMP at $2.77 and has lost 1.19% of its market capitalization in the last 24-hour period. Trading volume has decreased by 6.78% in the intraday trading session. This shows that SNX is currently facing distribution as it’s returning from the distribution level. Volume to market cap ratio is 0.2103.
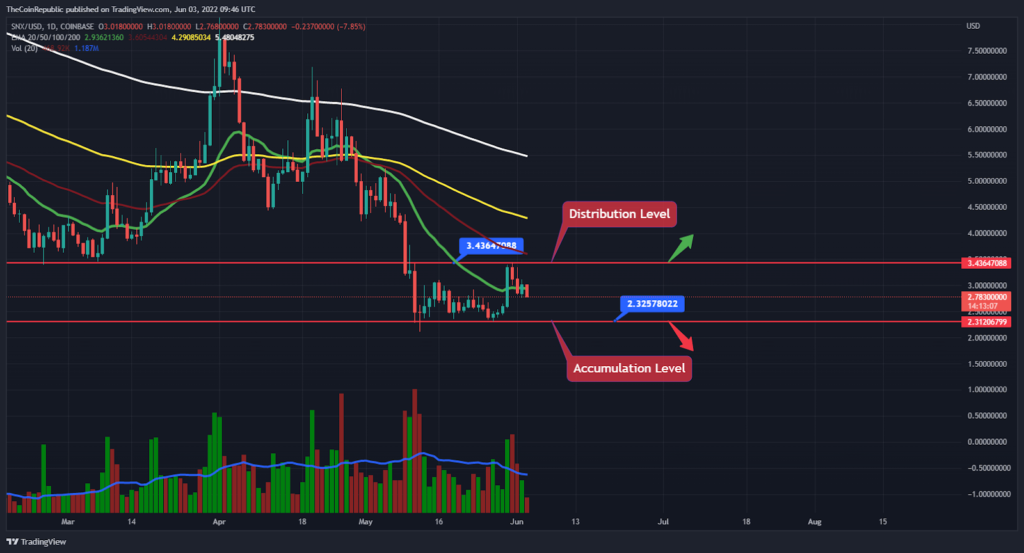
SNX coin price must gain a steady uptrend momentum to register its breakout of the consolidation area. However, SNX got stuck between the two distribution and accumulation levels, which are $3.43 and $2.32, respectively. SNX bulls need to accumulate themselves to register the token’s breakout of the range-bound area. Meanwhile, bears are currently overpowering the token as the token faces short-selling pressure over the daily chart. However, volume change can be seen below average and needs to grow for SNX to register its breakout and skip consolidating.
SNX Bulls: Accumulation Required
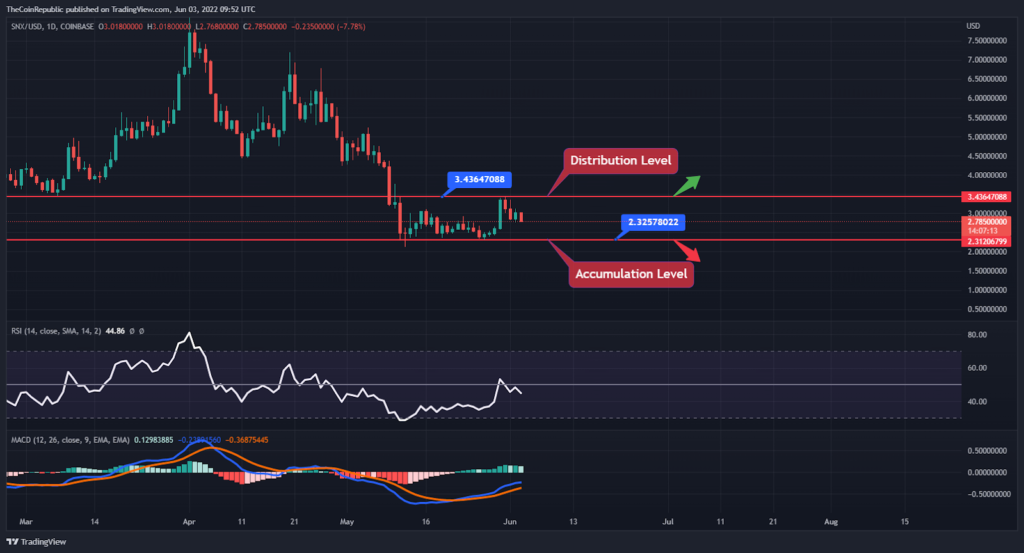
Synthetix bulls strictly need to accumulate themselves to register the token’s recovery phase over the daily chart. SNX coin price must head towards the distribution level by accumulating buyers and registering its breakout. Technical indicators suggest the current downtrend momentum of SNX. Relative Strength Index showcases the consolidation phase of the SNX coin. SNX token hasn’t been either oversold or overbought since April 2022. This means SNX coin has not witnessed either of the steady bearish or bullish momentum over the daily price chart. It has been consolidating inside a range-bound area for so long.
MACD exhibits the consolidation phase of SNX coin. The MACD line is ahead of the signal line after a positive crossover. However, SNX investors need to wait for any directional change to conclude any momentum of SNX coin.
Conclusion
Synthetix price has been sideways inside a range-bound area over the daily chart. The token tried to escape the range and head towards the distribution level, but accumulation was not upto the mark, and SNX failed to break out of the consolidation phase. SNX coin price must head towards the distribution level by accumulating buyers and registering its breakout. SNX investors need to wait for any directional change to conclude any momentum of SNX coin.
Technical Levels
Support Level: $2.32
Resistance Level: $3.43
Disclaimer
The views and opinions stated by the author, or any people named in this article, are for informational ideas only, and they do not establish the financial, investment, or other advice. Investing in or trading crypto assets comes with a risk of financial loss.

Andrew is a blockchain developer who developed his interest in cryptocurrencies while pursuing his post-graduation major in blockchain development. He is a keen observer of details and shares his passion for writing, along with coding. His backend knowledge about blockchain helps him give a unique perspective to his writing skills, and a reliable craft at explaining the concepts such as blockchain programming, languages and token minting. He also frequently shares technical details and performance indicators of ICOs and IDOs.


