
 Home
Home News
News

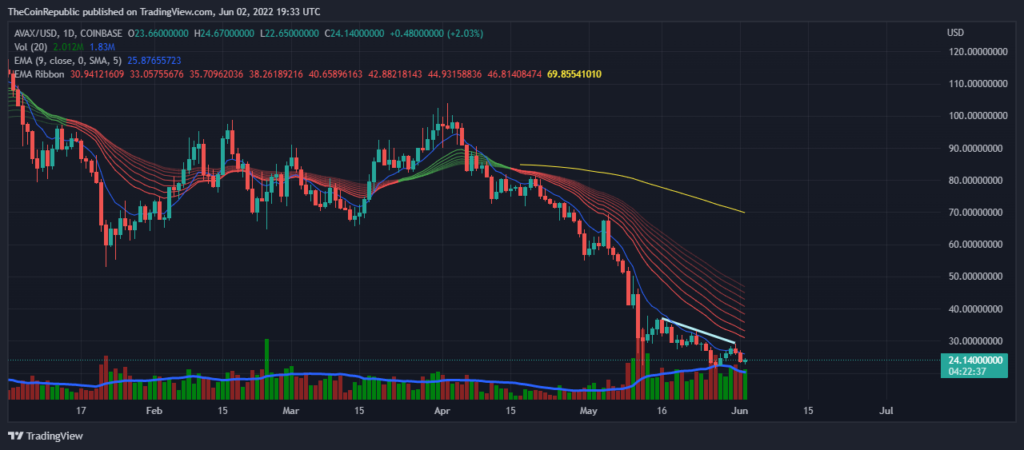
- The avax price is facing an calming waves of downtrend over the daily graph amid the bearish pressure.
- The crypto asset is trading below the exponential moving average.
- The AVAX/BTC pair is at 0.0008013 BTC with a loss of 0.50% in it
Avalanche is the fastest smart contracts platform in the blockchain industry, as measured by time to finality. Avalanche is blazingly fast, low cost, and eco-friendly. It is a hard capped, scarce asset that is used to pay for fees, secure the platform through staking, and providing a basic unit of account between the multiple subnets created on Avalanche.

The avax price is facing an overall downtrend over the daily graph amid the bearish pressure. The bulls tried to reverse the trend and the coin started a recovery phase. The price ascended for 3 consecutive days, but as expected the bears scattered the bulls and made the price fall again. The coin needs to accumulate bulls again and this time more firmly to make the coin recover. The price is moving considerably low below the exponential moving average.

The current price for one AVAX coin is trading at 24.12 with a loss of just 0.41% in its market capitalisation in the last 24 hrs. The coin has a trading volume of 656 million with a loss of 0.65% in the 24 hrs trading session and a market cap of 6.7 billion with a gain of 3.04% in it. The volume market cap ratio is 0.09741.
Short term Analysis
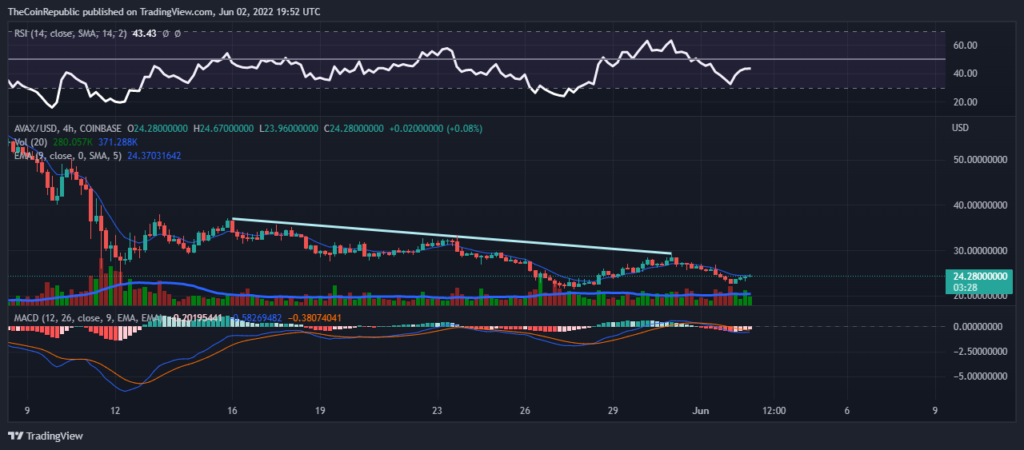
Analyzing the graph for a short term (4 hrs) we can observe the waves of downtrend. Looks like the bears are dominating. The whole crypto market is facing hard times. Analysts believe that if the same situation continues the coin may fall below the $20 support soon and then it can be a difficult situation for the AVAX bulls to make the coin recover.
In support the technical indicators also indicate a bearish pressure.
The MACD concludes the bearish pressure as the MACD line is moving below the MACD signal line and the histogram is riding red.
The relative strength index also took a U-turn toward the lower side indicating the increase in selling. The RSI value is currently below 45.
Conclusion
The avax price is facing an overall downtrend over the daily and hourly time graph amid the bearish pressure. The coin needs to accumulate bulls and make the coin recover. The technical indicators suggest a bearish movement further.
Technical levels
Resistance levels: $28 and $32
Support levels: $20 and $17.5
Disclaimer
The views and opinions stated by the author, or any people named in this article, are for informational ideas only, and they do not establish the financial, investment, or other advice. Investing in or trading crypto assets comes with a risk of financial loss.
ALSO READ: Coinbase Faces Class-Action Lawsuit Over TerraUSD

Andrew is a blockchain developer who developed his interest in cryptocurrencies while pursuing his post-graduation major in blockchain development. He is a keen observer of details and shares his passion for writing, along with coding. His backend knowledge about blockchain helps him give a unique perspective to his writing skills, and a reliable craft at explaining the concepts such as blockchain programming, languages and token minting. He also frequently shares technical details and performance indicators of ICOs and IDOs.


