
 Home
Home News
News

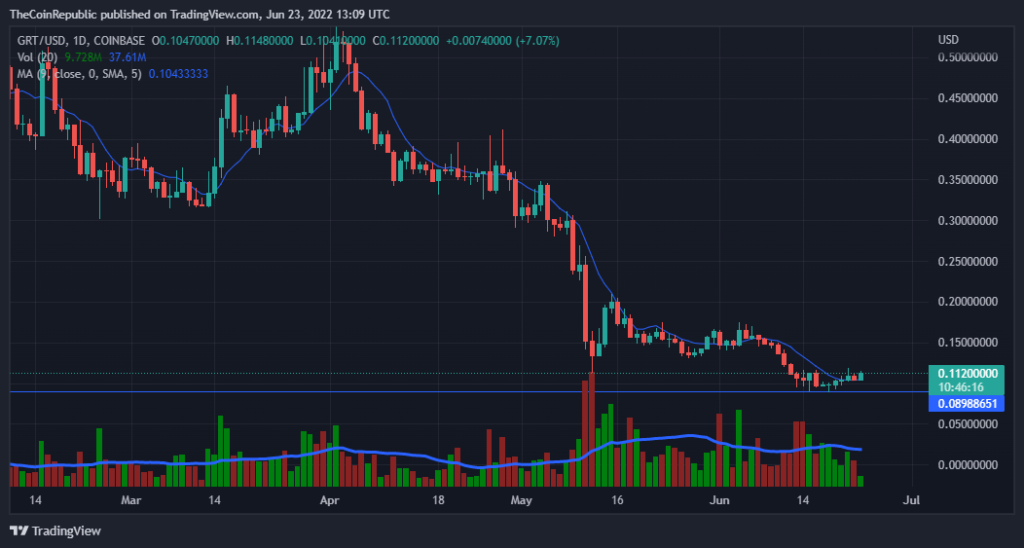
- The GRT price after a downtrend now trying to make a trend reversal over the daily chart. Still need to attract more buyers.
- The technical indicators appear to be in favor of bulls this time.
- The GRT/BTC pair is at 0.000005318 BTC with a gain of 1.94% in it.
The Graph (GRT) is an indexing protocol for querying data for networks like Ethereum and IPFS, powering many applications in both DeFi and the broader Web3 ecosystem. The Graph is working to bring reliable decentralized public infrastructure to the mainstream market.

After long waves of downtrend the graph price is now making a green move over the daily chart. This means that the token has successfully managed to accumulate bulls. The bears will not just watch, they will definitely try to interrupt the process. So the investors must be ready for the unpredictable market. The price is moving above the exponential moving average and the volume is at a decrease of 24.96% this means the buyings are still not meeting the requirements of recovery, bulls need to focus on this. The price is moving near its all time low.

The current price for one GRT token is $0.112 with a gain of 5.23% in its market capitalization in the last 24 hrs. The token has a volume of 39 million with a loss of 24.96% in just 24 hrs and a market cap of 772 million. The volume market ratio is 0.04887
Let’s see what do Technical Indicators Suggest for GRT
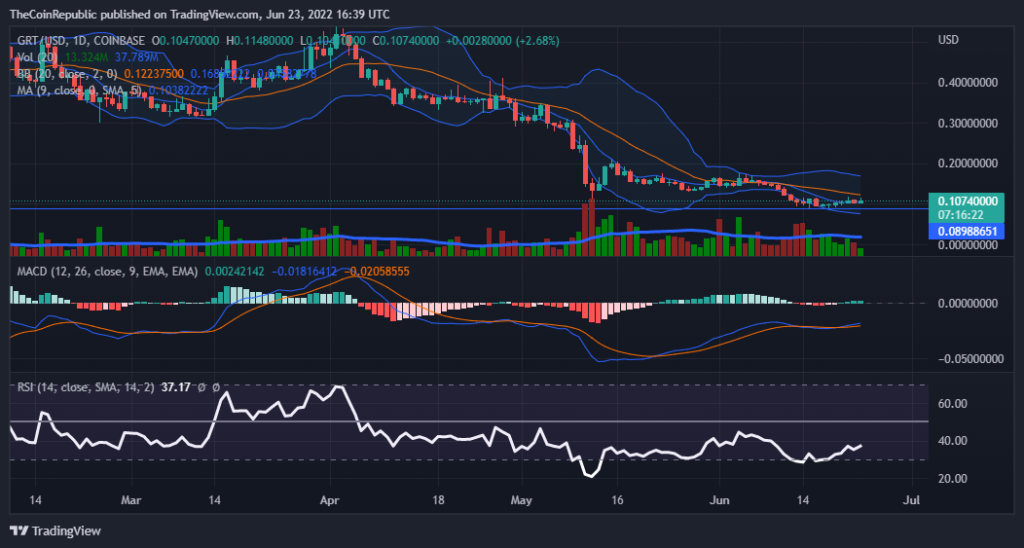
The volume is still at a decrease from the opening and moving below the average.
The price is still moving below the 20, 50, 100 and 200 daily moving average.
While observing the MACD we can get an idea of the bullish movement further, as the MACD line is moving above the MACD signal line after the positive cross, it looks like the signal is getting stronger as the gap between the MACD and MACD signal line is increasing.
The relative strength index is moving upwards indicating the increase in buying and supporting the bullish run. The RSI value for GRT is above 35.
ALSO READ – Ripple CEO Condemns The Legendary Regulator For Contradictions On Regulating Crypto
Conclusion
After long waves of downtrend the graph price is now making a green move over the daily chart. This means that the token has successfully managed to accumulate bulls. The volume is still at a loss of 25%. The technical indicators appear in the favor of bulls this time and the signal is getting stronger with time.
Technical levels
Resistance levels: $0.11 and $0.14
Support levels: $0.089 and $0.079
Disclaimer
The views and opinions stated by the author, or any people named in this article, are for informational ideas only, and they do not establish the financial, investment, or other advice. Investing in or trading crypto assets comes with a risk of financial loss.
Steve Anderson is an Australian crypto enthusiast. He is a specialist in management and trading for over 5 years. Steve has worked as a crypto trader, he loves learning about decentralisation, understanding the true potential of the blockchain.


