
 Home
Home News
News

- Fantom Coin overcame selling pressure as it broke a falling wedge trendline on the daily price chart.
- The FTM coin has started moving higher in the red cloud of the Ichimoku indicator on the daily price chart.
- The Stoch RSI has moved into overbought territory in terms of the daily price scale.
Fantom Coin started trading higher with a higher low and a higher high price pattern on the daily and 4-hours price chart. Meanwhile, traders are looking for solid bullish opportunities. Recently, the FTM price has been trading above the bullish barrier recently.

Meanwhile, the FTM coin broke the short-term horizontal range on an upside. Thus, as of press time, the altcoin is trading at the $0.311 mark.

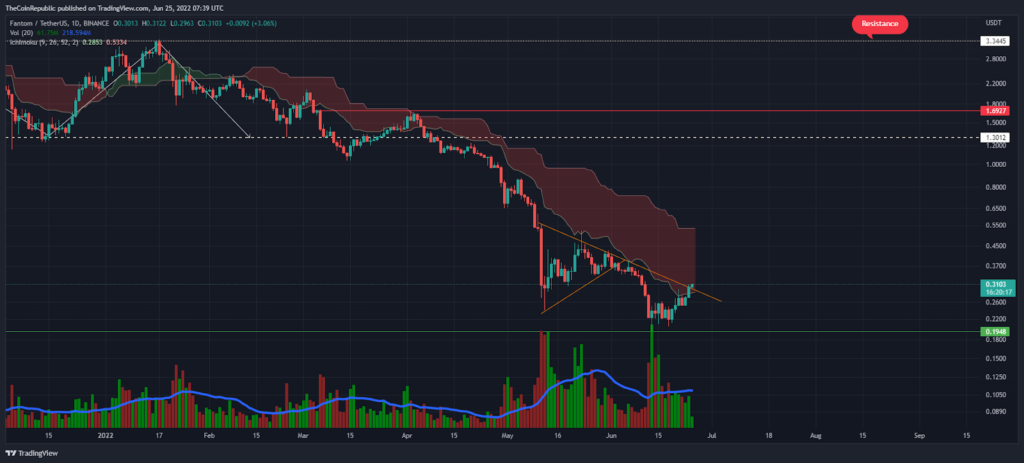
Since June 14, trading volume has continued to decline, therefore, the daily trading volume bar remains below the moving average (blue). Amid a bullish trend, low trading volume indicates a low probability of a further rally.
Meanwhile, according to CMC, the market for Fantom Coin is still growing from $9 million to $800 million. However, it gained 13% in the last 24 hours. The price of the Fantom and Bitcoin pair is up 9.9% at 0.000001446 satoshis.
The crucial round level of $0.20 is forming an important defensive zone for the bulls, on the other hand, the Mark Bears may attempt a pull-back near $0.50. Although the bulls broke the bearish trend line, still the bulls need to gather more capacity to see a further rise.
The FTM coin has started moving higher in the red cloud of the Ichimoku indicator on the daily price chart. Amid a directional trend, the Leading Span A (at $0.286) turned into a short-term support level.
Bulls break bearish trendline
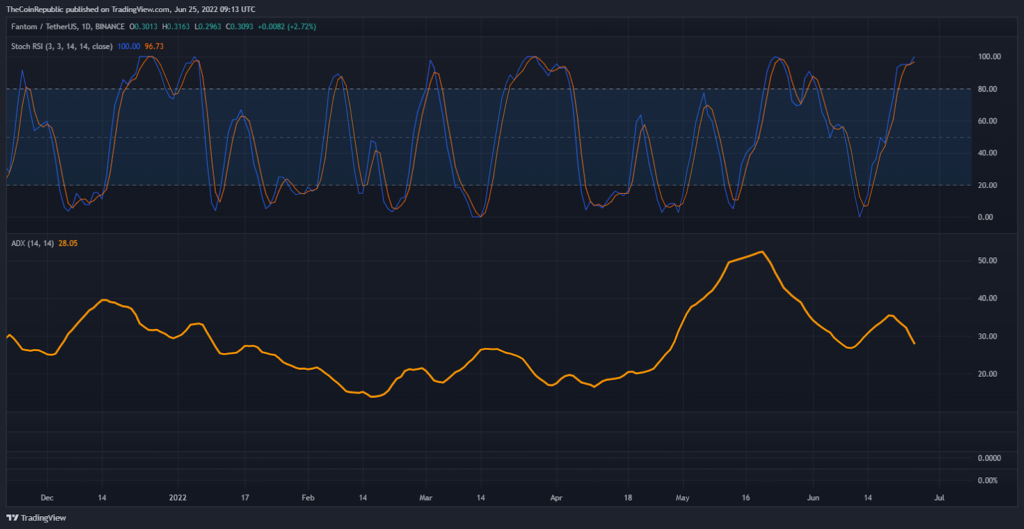
In terms of the daily price chart, the Stoch RSI has moved into overbought territory on the other hand, with ADX making a low-high, indicating a weak bullish trend.
conclusion
Fantom price could be volatile in the red zone of the Ichimoku indicator. But bulls have a defense zone so a sharp sell-off will be quite possible.
Technical Levels
Resistance level- $0.50 and $1.0
Support level- $0.20
Disclaimer
The views and opinions stated by the author, or any people named in this article, are for informational ideas only and do not establish the financial, investment, or other advice. Investing in or trading crypto assets comes with a risk of financial loss.
ALSO READ: Cardano Price Analysis: Will ADA ever reach $1.00?

Nancy J. Allen is a crypto enthusiast, with a major in macroeconomics and minor in business statistics. She believes that cryptocurrencies inspire people to be their own banks, and step aside from traditional monetary exchange systems. She is also intrigued by blockchain technology and its functioning. She frequently researches, and posts content on the top altcoins, their theoretical working principles and technical price predictions.


