
 Home
Home News
News
- The Graph Token breaks out of the range bound phase in an intraday trading session.
- GRT Crypto has gained over 19% in the last 24 hours, resulting in a market cap of $917 million.
- Trading volume was at its peak last night, hence the breakout occurred.
The Graph Token coin has breached its horizontal boundary of the consolidation phase. Today new investors take a deep breath after the breakout. However, GRT buyers have accumulated altcoin price well in this horizontal range, hence buyers can see further upside in the asset for a longer term outlook.

The Graph Token is trading at the $0.1326 mark at the time of writing. This week has been a good week for GRT buyers as the altcoin price continues to form high-lows throughout the daily price scale.

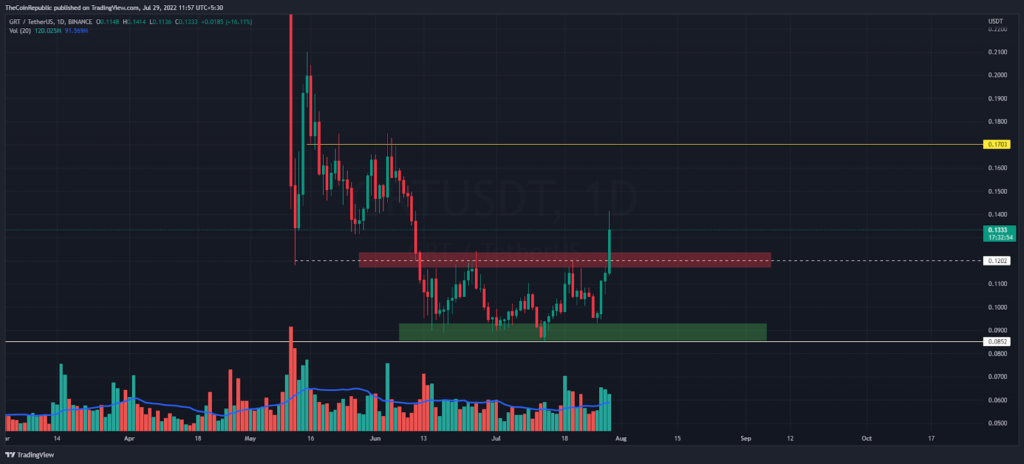
In the fall of 2022, buyers witnessed a 6-month low of $0.0848 mark. The market cap of GRT Crypto has been steadily increasing. Thus, according to CMC, there was a 19% increase in purchases at Capitalizatoin in the last 24 hours to $975 million.
Trading volume shows a highly volatile session this week as the daily volume bar stays above the moving average (blue). In addition, the GRT token belonging to the Bitioicn pair is in the green zone at 13.8% 0.000005463 Satoshis.
The GRT Token is Higher Above 50 DMA
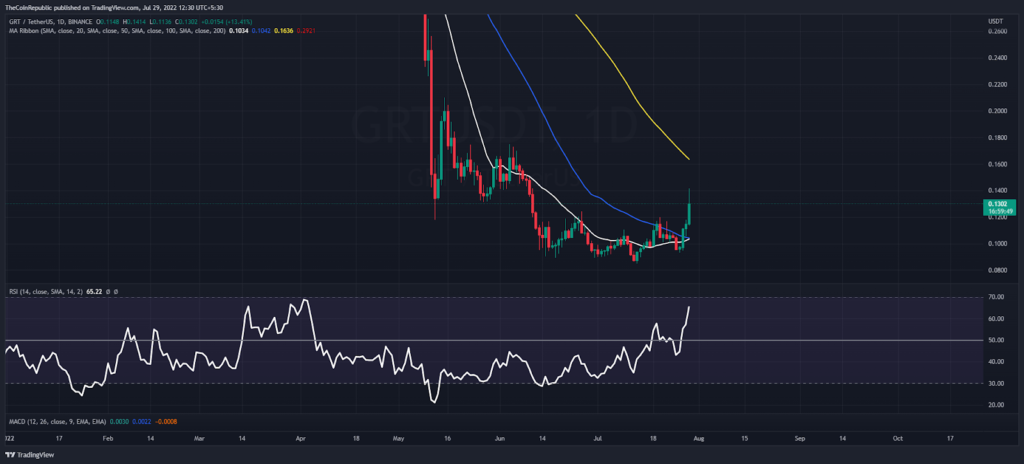
In terms of daily price scale, Graph Token is trading above the 20 as well as the 50-day EMA. Now the altcoin price is moving towards the 100-day moving average. Meanwhile, the 50 DMA turned into an immediate support level.
Besides, the daily RSI indicator is about to move into an extremely high zone. The RSI indicator suggests bullish momentum for the GRT token.
Conclusion
The Graph Token has converted its resistance area into a support level. Also, the 50 DMA may act as a pumping zone for the GRT token on the daily chart. Now the next bullish barrier for buyers is the 100 DMA.
Support level – $0.10 and $0.08
Resistance level – $0.17 and $0.20
Disclaimer
The views and opinions stated by the author, or any people named in this article, are for informational ideas only. They do not establish financial, investment, or other advice. Investing in or trading crypto assets comes with a risk of financial loss.
Steve Anderson is an Australian crypto enthusiast. He is a specialist in management and trading for over 5 years. Steve has worked as a crypto trader, he loves learning about decentralisation, understanding the true potential of the blockchain.


