
 Home
Home News
News
- The Graph Price has been sideways inside the horizontal range-bound area over the daily chart.
- GRT crypto is trading above 20 EMA and is still behind 50, 100 and 200-days Daily Moving Average.
- The pair of GRT/BTC is at 0.000004776 BTC with an intraday gain of 5.53%.
The Graph price has been trapped inside the consolidation phase and struggles to escape the range. GRT bulls need to accumulate themselves to sustain at the current level. The token must attract more buyers in order to surge towards the upper price range of the consolidation phase. GRT token has been trading inside the range of $0.087 and $0.12. GRT bears are trying to pull the token back towards the lower range after GRT gained around 13% in the last 24-hour. GRT investors need to wait for any directional change over the chart.
The Graph price is currently approximated at $0.108 and has gained around 13% of its market capitalization in the last 24-hour period. Trading volume has increased drastically by 165.22% in the intraday trading session. This indicates that bulls accumulation is at its peak and GRT needs to push its limit to surge towards the upper range. Volume to market cap ratio is 0.141.
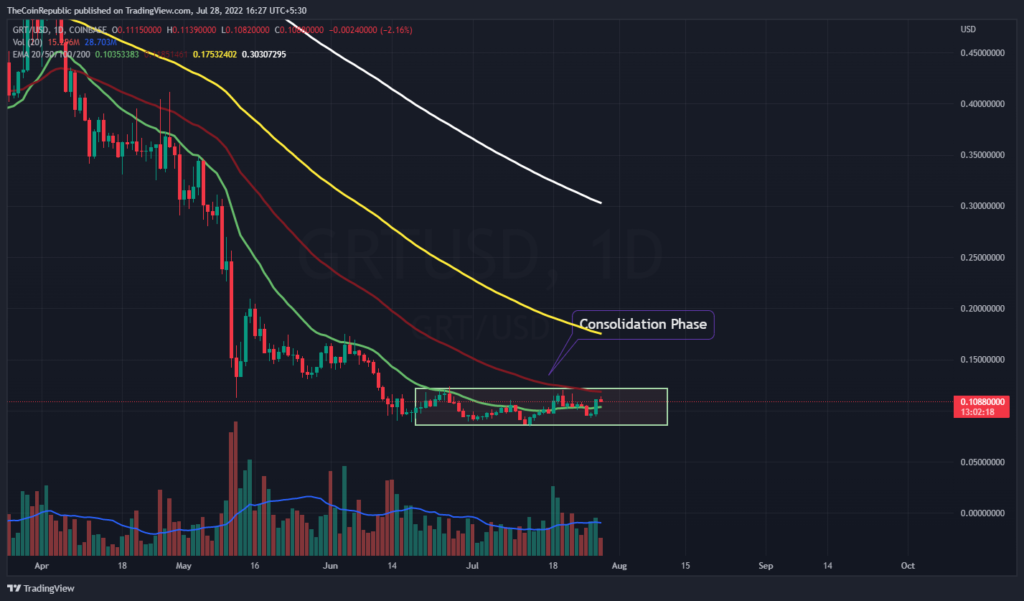
GRT coin price has been trading inside the horizontal range-bound area over the daily price chart. The token needs to attract more buyers in order to sustain at the current level and maintain the uptrend momentum of the token. However, volume change can be seen below average and needs to grow for GRT to surge. GRT token must be prepared to register its recovery phase as soon as it breaks out of the consolidation phase.
What do Technical Indicators suggest about GRT?
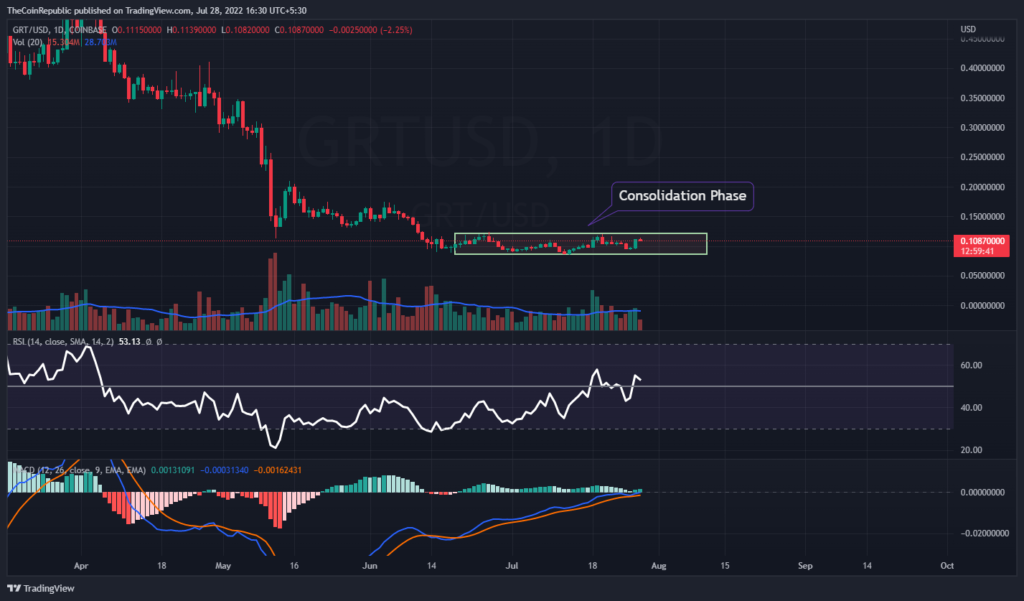
GRT coin price needs to attract more buyers to surge towards the upper price range of the consolidation phase. Technical indicators suggest the downtrend momentum of GRT inside the consolidation phase.
Relative Strength Index showcases the downtrend momentum of GRT coin. RSI is at 53 and is preparing to break down from neutrality.
MACD exhibits the bearish momentum of the GRT coin. The MACD line is heading towards the signal line for a negative crossover.
Conclusion
The Graph price has been trapped inside the consolidation phase and struggles to escape the range. GRT bulls need to accumulate themselves to sustain at the current level. The token must attract more buyers in order to surge towards the upper price range of the consolidation phase. GRT token has been trading inside the range of $0.087 and $0.12. GRT bears are trying to pull the token back towards the lower range after GRT gained around 13% in the last 24-hour. However, volume change can be seen below average and needs to grow for GRT to surge. GRT token must be prepared to register its recovery phase as soon as it breaks out of the consolidation phase. Technical indicators suggest the downtrend momentum of GRT inside the consolidation phase.
Technical Levels
Support Levels: $0.095 and $0.085
Resistance Levels: $0.116 and $0.122
Disclaimer
The views and opinions stated by the author, or any people named in this article, are for informational ideas only, and they do not establish the financial, investment, or other advice. Investing in or trading crypto assets comes with a risk of financial loss.
Saurav Bhattacharjee is in charge of the Broadcast development team of The Coin Republic.
He has been covering the Metaverse and NFT niche for the past 2 years.
With stellar interviews on his portfolio like Nicehash, Paxful, WallstreetWolvesNFT, Bitholla, Totemfi, EOS.io etc. Saurav has spearheaded the NFT SUPERSTARS AWARD and successfully hosted the first award in 2021.


