
 Home
Home News
News
- Over the daily price chart, the SOL price is condensed in a variety of parallel channels.
- The technical indicators are showing the return of bulls and probability of breakdown.
- The SOL/BTC pair is at 0.001863 BTC which is at a significant gain of 5.14%.
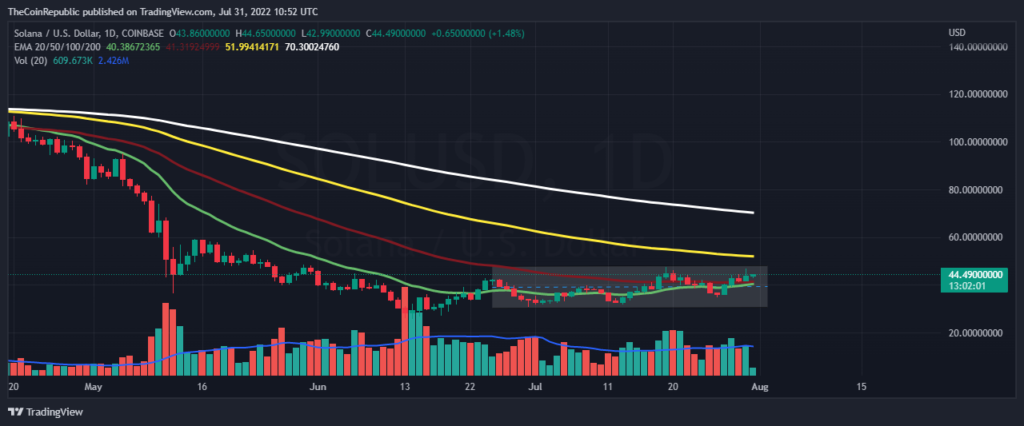
The SOL price is consolidated in a range of parallel channels over the daily price chart, sometimes the price is manipulated by the bulls and rest by bears. This signifies, under the influence of both the gangs the price is trapped and no one is ready to give up their dominance over the market.
Currently the bulls are handling the price and pushing it towards the resistance of the channel, besides this bearish interruption is continued. The bulls must exert constant efforts in order to register a breakout, or else these bears are just waiting for an opportunity to smash their efforts and to score a breakdown. Now considering the current low prices, it will be challenging for the bulls to handle a breakdown of the coin.
The current price for one SOL coin is trading at $44.33 which is at a gain of 5.26% in its market capitalization in the last 24 hrs. The coin has a trading volume of 1.8 billion which is at an insignificant gain of 0.64% in the 24 hrs trading session and has market cap of 15 billion. The volume market cap ratio is 0.1229.
Can Bulls Break through for SOL?
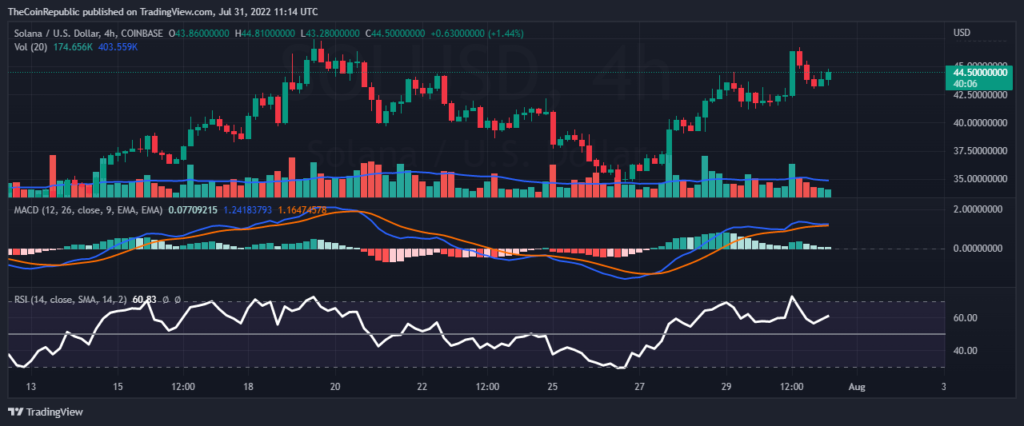
The SOL price is moving at an uptrend movement over the daily as well as hourly price chart. This signifies the bulls are in action and dominating the market.
The technical indicators like MACD was about to give a negative crossover but now as the return of bullish dominance the MACD line is still moving above the MACD signal line and the gap is increasing again. The relative strength index supporting the same by showing the increase is buyings. The RSI value is nearly equal to 60.
Conclusion
The SOL price is consolidated in a range of parallel channels of resistance and support $47.6 and $30.96 respectively over the daily price chart. The bulls must exert constant efforts in order to register a breakout, or else these bears are just waiting for an opportunity to smash their efforts and to score a breakdown. The technical indicators show the return of bulls and indicate a bullish movement further.
ALSO READ – 6th Place ADA Replaced By XRP As It Surges by 11%
Technical levels
Resistance levels: $47.6 and $54.3
Support levels: $30.96 and 25.97
Disclaimer
The views and opinions stated by the author, or any people named in this article, are for informational ideas only. They do not establish financial, investment, or other advice. Investing in or trading crypto assets comes with a risk of financial loss.

Nancy J. Allen is a crypto enthusiast, with a major in macroeconomics and minor in business statistics. She believes that cryptocurrencies inspire people to be their own banks, and step aside from traditional monetary exchange systems. She is also intrigued by blockchain technology and its functioning. She frequently researches, and posts content on the top altcoins, their theoretical working principles and technical price predictions.


