
 Home
Home News
News

- It seems that the bears are trying to manipulate the market of the NEM
- The current price of NEM is currently around $0.051572 with a total incline of 2.10% during the intraday trading session
- The pair of NEM/BTC is at 0.000002237 BTC and has dropped by 1.56% during the last 24 hours
The bears have given a bite to dust to the bulls the bears have been trying many times to bear the bulls and now the bears have taken over the market of the NEM. The bulls somehow managed to bring the price to their desired zone. But the bears have brought the bearish trend the bulls have got a harsh defeat. The bulls have to work hard to take the price to follow the upward trend the investors are relied on the bulls to raise their hopes. The bulls have come up with an extraordinary plan to beat the bulls now the price of the coin is heading toward the desired zones of the bears.

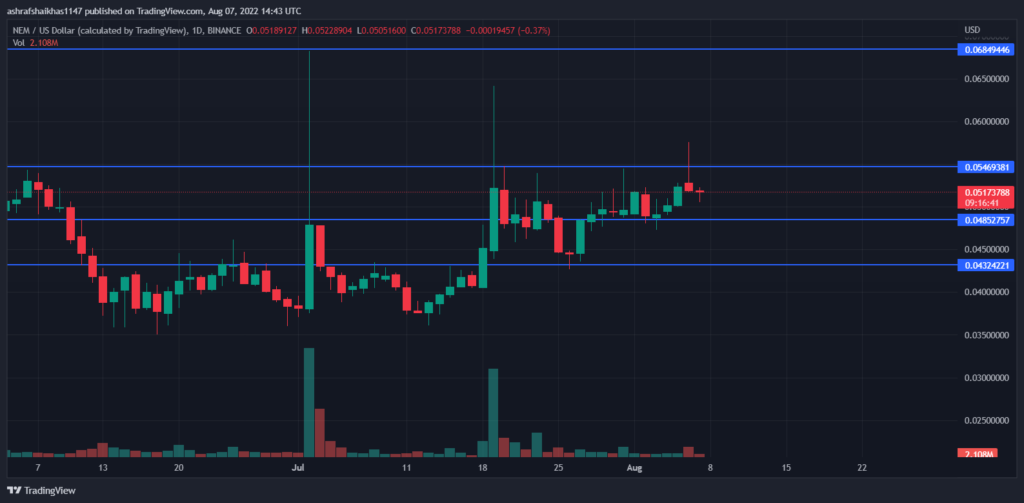
The current price of the NEM is approx $0.051572 with a total decline of 2.10% during the intraday trading session and the pair of NEM/BTC is currently around 0.000002237 BTC and has dropped by 1.56% during the last 24 hours. It seems that the coin has started to follow the downward trend the NEM is losing its potential which may mislead the investors. As the bears broke the bullish trend and now it has become difficult to predict any movement over the daily price chart. If the bulls come up with stronger plans the price may reach up to the primary resistance of $0.0546 and if the bulls make a stronger move they may take the price up to the secondary resistance of $0.0684. If the bullish trend continues the price may reach the primary support of $0.0485 and if bulls show stillness and the bearish trend continues

The price may reach the secondary support of $0.0432
The volume of the coin has dropped by around 61.94% during the intraday trading session the continuous drop in the volume indicates that the selling pressure has increased. The volume to market cap ratio is around 0.02211
The increasing selling pressure may lead to a bearish trend the sellers must show some movement. The bears are entering the trade we couldn’t expect an increase in the volume of the coin and the coin may revive to its potential.
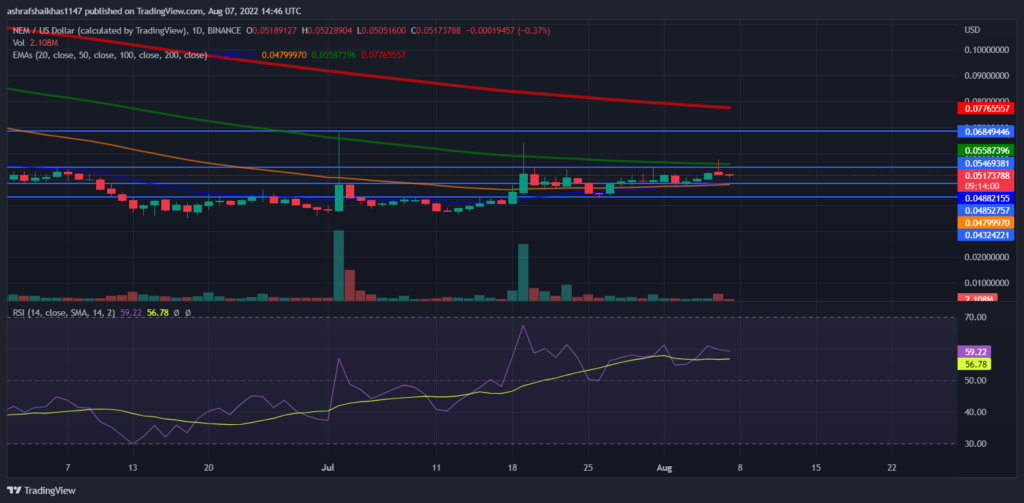
The technical indicator shows the following: The relative strength index is in the overbought zone and RSI is still heading towards the over brought zone The current RSI is 59.22 which is above the average RSI. the average RSI is 56.78. The price is moving ahead of the 20,50 estimated moving average and is still lagging behind the 100,200 daily moving average.
ALSO READ – Debridge Finance Accuses North Korean Hackers Lazarus Group Of Cyberattack
Technical Levels
Support Levels: $0.0432 and$0.0485
Resistance Levels: $0.0546 and $0.0684
Disclaimer
The views and opinions stated by the author, or any people named in this article, are for informational ideas only. They do not establish the financial, investment, or other advice. Investing in or trading crypto assets comes with a risk of financial loss.

Andrew is a blockchain developer who developed his interest in cryptocurrencies while pursuing his post-graduation major in blockchain development. He is a keen observer of details and shares his passion for writing, along with coding. His backend knowledge about blockchain helps him give a unique perspective to his writing skills, and a reliable craft at explaining the concepts such as blockchain programming, languages and token minting. He also frequently shares technical details and performance indicators of ICOs and IDOs.


