
 Home
Home News
News

- LINK token price has been on the rise for the past two weeks and recently it broke the important supply zone.
- The LINK token price has started forming higher high and higher low formations on a daily time frame.
- The pair of LINK/BTC is trading at the price of 0.0003582 with a decrease of -0.52% in the past 24 hours.
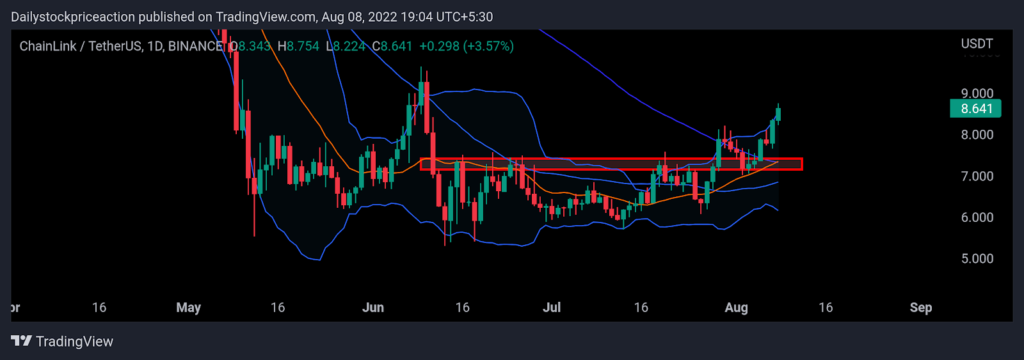
The LINK token price is trading at the long-term supply zone after breaking every small-term resistance. As of now, the token has started consolidating In an hourly time frame. The token has shown bullish momentum on a weekly time frame. The LINK token price was forming an inverted head and shoulder pattern on a daily time frame. Recently, the token price gave a breakout of this bullish pattern. Since then the token price has been in a strong uptrend. As of now, the token price has given a breakout of 50 and 100 MA. Moving forward the token price can be seen resting at these Moving Averages. The token price has also given a breakout of 14 SMA. At present, the token price is trading at the upper band of the Bollinger band indicator after bouncing off the lower band. Volumes have increased causing the volatility to increase. Therefore investors should remain cautious as they can be trapped on either side. The range of Bollinger bands is wide due to recent bullishness. Therefore the investors can expect some side movement in the upcoming days in the price LINK token.

The LINK token price has given a breakout of rounding bottom pattern on a 4-hour time frame
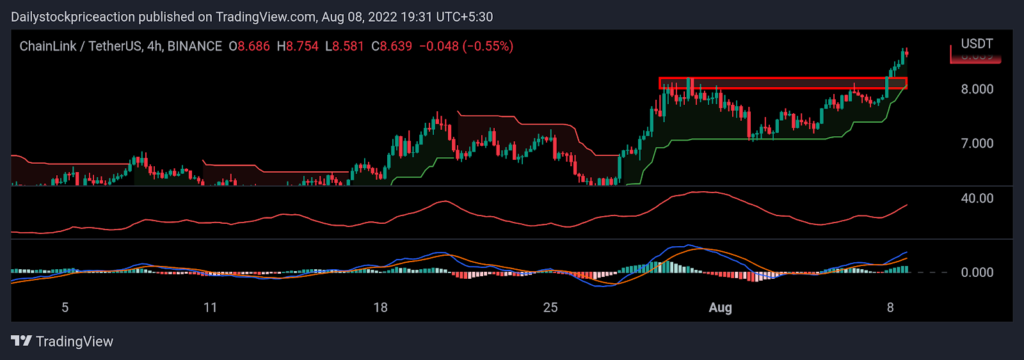
Average Directional Movement Index: ADX curve has been rising on a higher time frame as the token continues to move upwards. In an hourly time frame, the ADX curve has dipped out of the 20 mark and has turned upwards. As seen in the 4-hour time frame the ADX curve has risen above the zone indicating strong bullishness. As the token price hovers around the supply zone, the ADX curve is still pointed upside. Investors should wait for a breakout of the supply zone with a positive candle formation.

Moving Average Convergence Divergence: MACD indicator has given a positive crossover as the token gave a breakout of the supply zone. The blue line crossed the orange line on the upside. This has resulted in the token price moving up strongly. Recently the LINK token price fell after the breakout of small resistance, as a result, the MACD indicator also depicted the same. Once the token price starts moving up again after retesting, the gap between the blue and orange lines can be seen widening supporting the trend.
Supertrend: The LINK token price rose above the supply zone with a strong bullish candlestick pattern. The token broke out of the super trend sell line which triggered the buy signal. As of now the LINK token is trading above the super trend buy signal line. Going forward this line could act as a strong support zone.
SUPPORT: $7.8 and $7.9
RESISTANCE: $8.0 and $8.1
Disclaimer
The views and opinions stated by the author, or any people named in this article, are for informational ideas only, and they do not establish the financial, investment, or other advice. Investing in or trading crypto assets comes with a risk of financial loss.

With a background in journalism, Ritika Sharma has worked with many reputed media firms focusing on general news such as politics and crime. She joined The Coin Republic as a reporter for crypto, and found a great passion for cryptocurrency, Web3, NFTs and other digital assets. She spends a lot of time researching and delving deeper into these concepts around the clock, and is a strong advocate for women in STEM.


