
 Home
Home News
News
- XTZ token price has been on an uptrend in a higher time frame.
- XTZ token price is trading in an upward parallel channel on a daily time frame.
- The pair of XTZ/BTC is trading at the price level of 0.000076 with a decrease of -1.07% in the past 24 hours.
The XTZ token price, as per the price action, is bullish despite the recent bearish pressure. As of now, the token price is making higher high and higher low formations on a daily time frame. The XTZ token price has fallen to the demand zone as it faced strong bearish pressure off the supply zone. On a lower time frame, the token price has broken the demand zone with a strong bearish candlestick pattern. Strong bearish candlestick formation at the supply zone, led to a rapid fall in the price of the XTZ token. At present, the XTZ token price is trading at the lower band of the Bollinger band indicator after failing to surpass the upper band. The XTZ token price is currently trading below the 100 and 50 Moving Average. Recent bearishness has led to the breakdown of these MAs. Moving towards these MAs could act as a strong resistance. Therofr investors should remain cautious and wait for a strong breakout of resistance and then act accordingly.
The XTZ token price as per the technical parameters is bearish
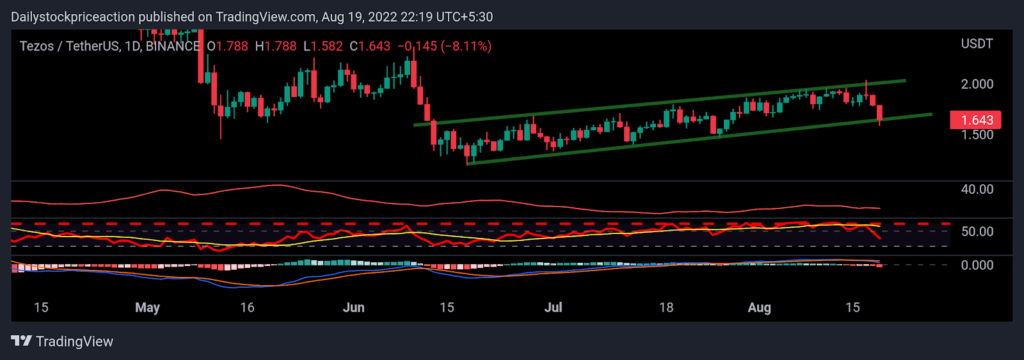
Average Directional Movement Index: ADX curve has been falling for the last couple of days as the token price faced rejection off the supply zone. As the XTZ token forms a bullish parallel channel pattern, the ADX curve is seen turning sideways. As of now, the ADX curve is trading below the mark of 20. Once the token price breaks the parallel channel pattern and starts moving up, the ADX curve can also be seen dipping out of the 20 mark supporting the trend.
Moving Average Convergence Divergence: MACD indicator is bearish as the token price falls. The MACD indicator gave a negative crossover after the token price failed to surpass the upper band of the Bollinger band indicator. The blue line crossed the orange line on the downside. Once the token price bounces off the demand zone, the MACD indicator can be seen giving a positive cross-over supporting the trend.
Relative Strength Index: The RSI curve is trading at the level of 39.99 as it follows the bearish trend. The XTZ token price faced strong rejection from the supply zone, and the same was depicted by the RSI curve as it started falling. As of now, the RSI curve has also fallen below the 20 EMA. The RSI curve is currently trading below the halfway mark of 50. Once the token price breaks the bullish parallel channel pattern, the RSI curve can be seen crossing the halfway mark of 50 supporting the breakout.
CONCLUSION: The XTZ token price is bullish on a larger time frame. On a lower time frame, the XTZ token price is falling as it faced the strong rejection of the supply zone. The technical parameters are bearish following the short-term trend. It remains to see if the token price will bounce back off the seamen zone of the bullish parallel chart pattern or fails to do so and breaks on the downside.
SUPPORT: $1.5 and $1.4
RESISTANCE: $2.0 and $1.9

Nancy J. Allen is a crypto enthusiast, with a major in macroeconomics and minor in business statistics. She believes that cryptocurrencies inspire people to be their own banks, and step aside from traditional monetary exchange systems. She is also intrigued by blockchain technology and its functioning. She frequently researches, and posts content on the top altcoins, their theoretical working principles and technical price predictions.


