
 Home
Home News
News
- Theta Network price has been falling since 13th August and has declined from a rising parallel channel over the daily chart.
- THETA crypto has fallen below 20, 50, 100 and 200-days Daily Moving Average.
- The pair of THETA/BTC is at 0.00005603 BTC with an intraday drop of 6.85%.
Theta Network price has fallen below an ascending parallel channel over the daily price chart. The token has declined below the channel and is still trading with strong downtrend momentum over the daily chart. THETA crypto needs to gather support from the buyers to escape the bearish rally. However, bears are dragging the token towards the lower levels. The token still needs to escape the bearish trap to avoid falling more over the daily chart. THETA investors need to wait for any directional change over the daily chart.
Currently, the market capitalization of Theta Network is CMP $1.21, a decrease of 13.96% from the previous day. However, during the intraday trading session, trading volume jumped by more than 36%. The volume is upbeat, and the THETA currency appears to be recovering. THETA bulls need to keep up their present rate of ascent in order to see the THETA token breakout. The volume to market cap ratio is 0.05208.
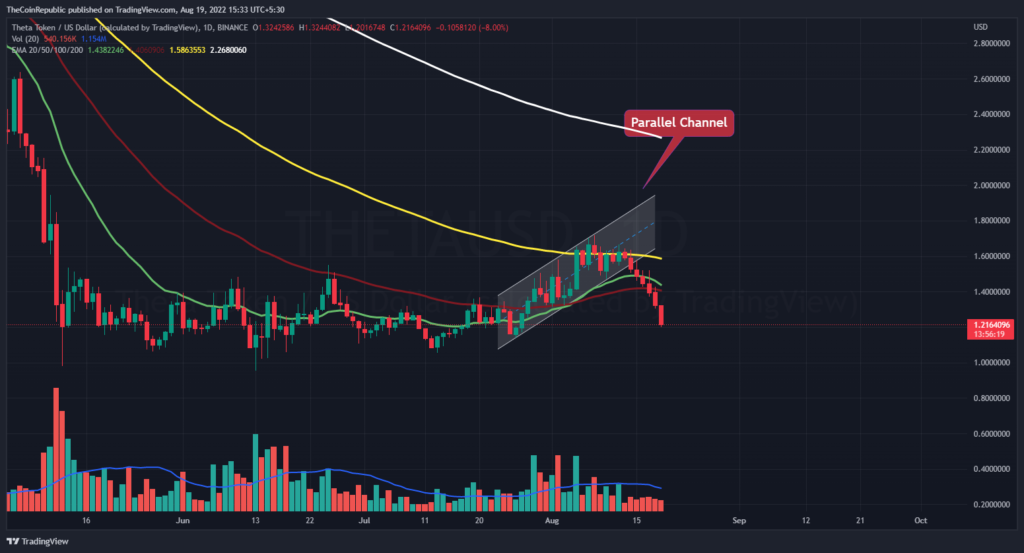
The price of the THETA currency has fallen below the ascending parallel channel on the daily price chart. The coin needs to draw buyers in order to avoid a sharp decrease throughout the daily price chart. However, when bears are present and above usual, volume change is obvious. This demonstrates that short sellers are exerting daily pressure on the THETA coin. THETA crypto has fallen below 20, 50, 100 and 200-days Daily Moving Average.
What do Technical Indicators suggest about THETA?
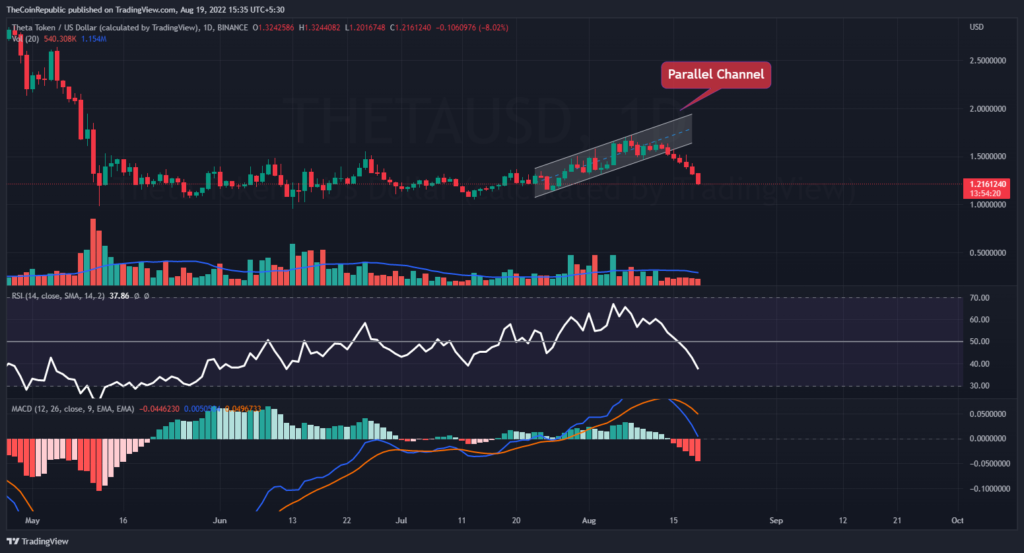
Over the course of the daily price chart, the THETA currency’s price has been varying inside a rising parallel channel. To exit the rising pattern, the token needs to move in the direction of the top trendline. The momentum of the THETA coin’s downward trend is shown by technical indicators.
The decreasing velocity of the THETA currency is indicated by the Relative Strength Index. At 37, the RSI is almost in oversold territory. The THETA currency is currently moving bearishly on the MACD. After a negative crossover, the MACD line is lower than the signal line. Investors in THETA should monitor the daily chart for any shifts in trend.
Conclusion
Theta Network price has fallen below an ascending parallel channel over the daily price chart. The token has declined below the channel and is still trading with strong downtrend momentum over the daily chart. THETA crypto needs to gather support from the buyers to escape the bearish rally. However, bears are dragging the token towards the lower levels. However, when bears are present and above usual, volume change is obvious. This demonstrates that short sellers are exerting daily pressure on the THETA coin. The momentum of the THETA coin’s downward trend is shown by technical indicators. After a negative crossover, the MACD line is lower than the signal line. Investors in THETA should monitor the daily chart for any shifts in trend.
Technical Levels
Support Level: $1.15 and $1.05
Resistance Level: $1.40 and $1.55
Disclaimer
The views and opinions stated by the author, or any people named in this article, are for informational ideas only, and they do not establish the financial, investment, or other advice. Investing in or trading crypto assets comes with a risk of financial loss.

Andrew is a blockchain developer who developed his interest in cryptocurrencies while pursuing his post-graduation major in blockchain development. He is a keen observer of details and shares his passion for writing, along with coding. His backend knowledge about blockchain helps him give a unique perspective to his writing skills, and a reliable craft at explaining the concepts such as blockchain programming, languages and token minting. He also frequently shares technical details and performance indicators of ICOs and IDOs.


