
 Home
Home News
News

- Uniswap price has declined below a rising parallel channel over the daily price chart.
- UNI crypto has slipped below 20, 50, 100 and 200-days Daily Moving Average.
- The pair of UNI/BTC is at 0.0003207 BTC with an intraday drop of 6.75%.
Uniswap price has declined below the rising parallel channel and has lost around 13% of its market capitalization in the last 24-hour period. UNI coin must gather support from the buyers and should rise back inside the rising parallel channel. However, bears are continuously trying to pull UNI coin below the rising channel. UNI bulls must accumulate themselves as soon as the UNI coin approaches the $6.65 support level. It’s a matter of time to see if UNI bulls succeed in providing support to the token to avoid the rejection from the current level.

Uniswap price is presently approximated at $7.01 and has lost 13.08% of its market capitalization in the last 24-hour period. However, trading volume has increased by 42% in the intraday trading session. This demonstrates that UNI bulls are still trying their way out to start the recovery phase of UNI coin. Volume to market cap ratio is 0.04215.

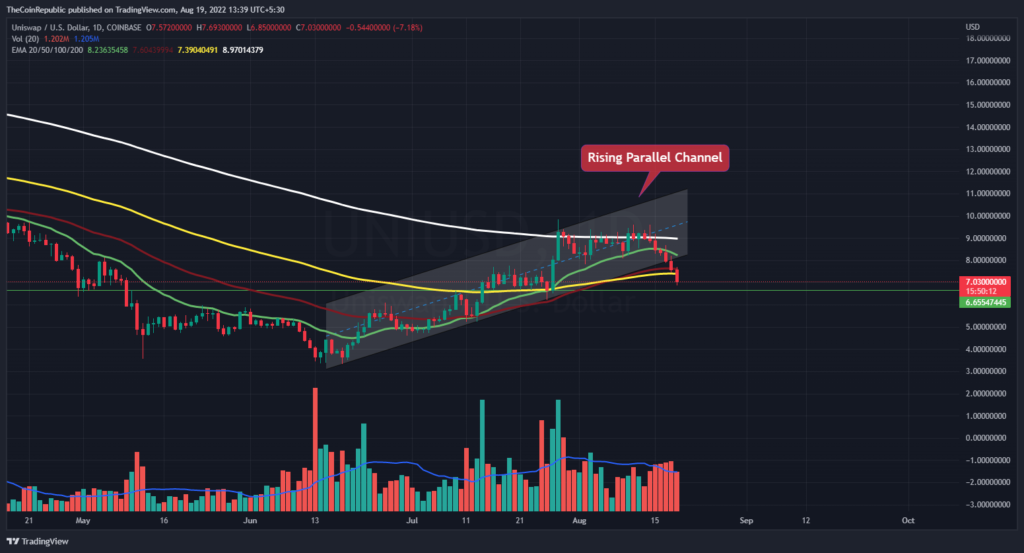
UNI coin price is trading with strong downtrend momentum over the daily price chart. The crypto asset has got rejected from an ascending parallel channel and is now declining over the daily chart. UNI bulls must accumulate themselves to let the token surge over the daily chart. Nevertheless, red giant volume bars signifies the involvement of bears and the fall of UNI crypto.
What do Technical Indicators suggest about UNI?
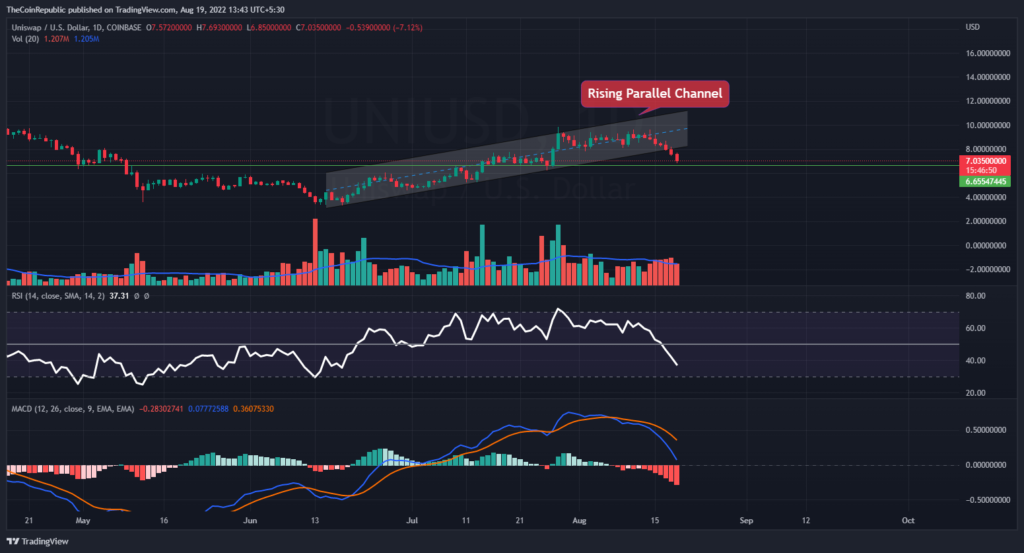
UNI coin price must gather support from the buyers to let the token surge over the daily price chart. The token must surge back inside the rising parallel channel over the daily price chart. Technical indicators suggest the downtrend momentum of UNI crypto.
Relative Strength Index showcases the downtrend momentum of UNI coin. RSI is at 37 and is approaching the oversold territory. MACD exhibits the bearish momentum of the UNI coin. The MACD line is below the signal line after a negative crossover. UNI investors need to wait for any directional change over the daily chart.
Conclusion
Uniswap price has declined below the rising parallel channel and has lost around 13% of its market capitalization in the last 24-hour period. UNI coin must gather support from the buyers and should rise back inside the rising parallel channel. However, bears are continuously trying to pull UNI coin below the rising channel. UNI bulls must accumulate themselves as soon as the UNI coin approaches the $6.65 support level. Nevertheless, red giant volume bars signifies the involvement of bears and the fall of UNI crypto. Technical indicators suggest the downtrend momentum of UNI crypto. UNI investors need to wait for any directional change over the daily chart.
Technical Levels
Support Levels: $6.65 and $6.25
Resistance Levels: $8.00 and $10.00
Disclaimer
The views and opinions stated by the author, or any people named in this article, are for informational ideas only, and they do not establish the financial, investment, or other advice. Investing in or trading crypto assets comes with a risk of financial loss.

Nancy J. Allen is a crypto enthusiast, with a major in macroeconomics and minor in business statistics. She believes that cryptocurrencies inspire people to be their own banks, and step aside from traditional monetary exchange systems. She is also intrigued by blockchain technology and its functioning. She frequently researches, and posts content on the top altcoins, their theoretical working principles and technical price predictions.


