
 Home
Home News
News
- Solana price has been caught inside the consolidation phase over the daily price chart.
- SOL crypto is trading below 20, 50, 100 and 200-days Daily Moving Average.
- The pair of SOL/BTC is at 0.001624 BTC with an intraday drop of 3.47%.
The price of the Solana has been stable inside a range-bound zone since June 8th. This existential crisis led to panic selling on the cryptocurrency market. In spite of the significant volatility of the cryptocurrency, investors are trying to keep onto their own investments. SOL is one of the digital currencies experiencing an existential crisis as it teeters at a record low. During this chaotic period, cryptocurrency investors must be as rock-solid as those with diamond hands. People with diamond hands won’t be as willing to sell their investments.

In terms of market value, the Solana price is currently CMP at $34.71, down 3.25% from the previous day. However, the trade volume is somewhat higher by 2.34% during intraday trading. This suggests that customers are getting in touch with vendors to withdraw SOL currency. Volume to market cap ratio is 0.09536.

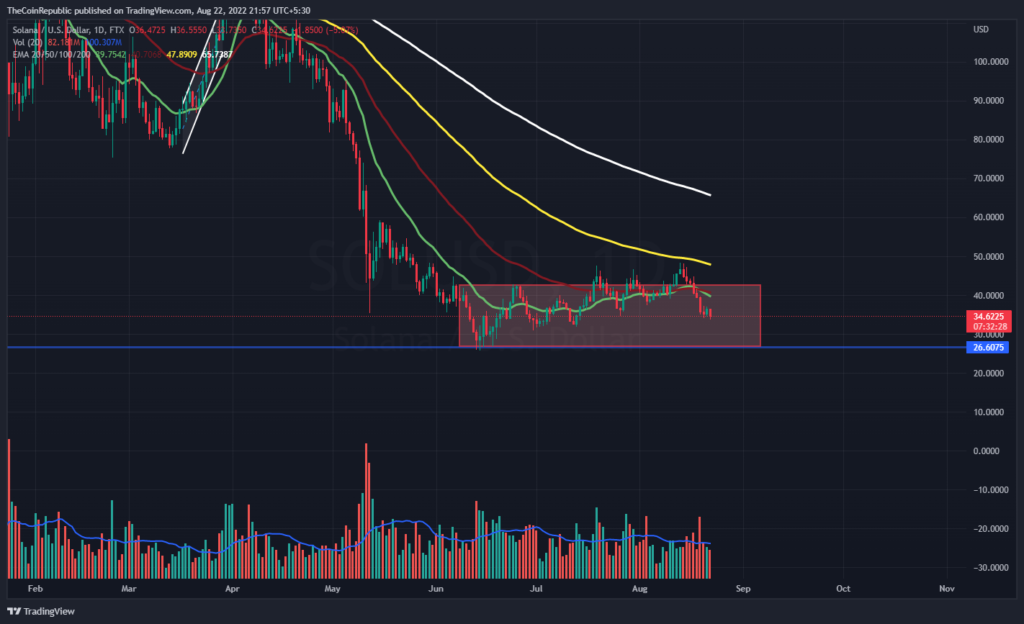
On the daily price chart, the SOL coin’s price is clearly on a downward trend. Due to the continued weak market, the cryptocurrency asset has returned to the consolidation phase close to the 2021 lows. If the SOL coin price is to increase back to the upper price range of the consolidation period, more buyers must enter the market. SOL has been consolidating inside the [price range of $27.00 and $42.00 The volume change, which is presently below average, must increase for SOL currency to cross the daily chart.
What do Technical Indicators suggest about SOL?
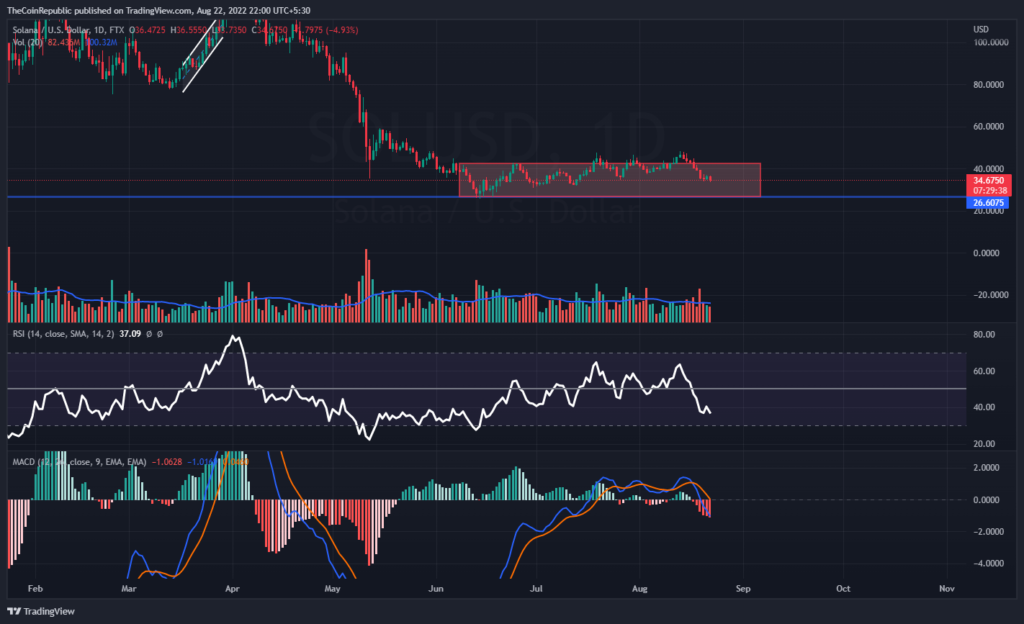
On the daily price chart, the price of solana is declining dramatically. In order to move quickly toward the top price range of the consolidation phase, SOL coin has to attract support from buyers. Technical indicators reflect the SOL coin’s downward trend’s momentum.
The SOL coin’s downward movement is depicted by the relative strength index (RSI). At 37, the RSI is on the verge of oversold territory. For the SOL coin, the MACD displays a bearish momentum. After a negative crossover, the MACD line is lower than the signal line. Investors in SOL should monitor the daily chart for any shifts in trend.
Conclusion
The price of the Solana has been stable inside a range-bound zone since June 8th. This existential crisis led to panic selling on the cryptocurrency market. In spite of the significant volatility of the cryptocurrency, investors are trying to keep onto their own investments. SOL is one of the digital currencies experiencing an existential crisis as it teeters at a record low. SOL has been consolidating inside the [price range of $27.00 and $42.00 The volume change, which is presently below average, must increase for SOL currency to cross the daily chart. Technical indicators reflect the SOL coin’s downward trend’s momentum.
After a negative crossover, the MACD line is lower than the signal line. Investors in SOL should monitor the daily chart for any shifts in trend.
Technical Levels
Support Level: $30.00 and $27.00
Resistance Level: $40.00 and $43.00
Disclaimer
The views and opinions stated by the author, or any people named in this article, are for informational ideas only, and they do not establish the financial, investment, or other advice. Investing in or trading crypto assets comes with a risk of financial loss.

Andrew is a blockchain developer who developed his interest in cryptocurrencies while pursuing his post-graduation major in blockchain development. He is a keen observer of details and shares his passion for writing, along with coding. His backend knowledge about blockchain helps him give a unique perspective to his writing skills, and a reliable craft at explaining the concepts such as blockchain programming, languages and token minting. He also frequently shares technical details and performance indicators of ICOs and IDOs.


