
 Home
Home News
News

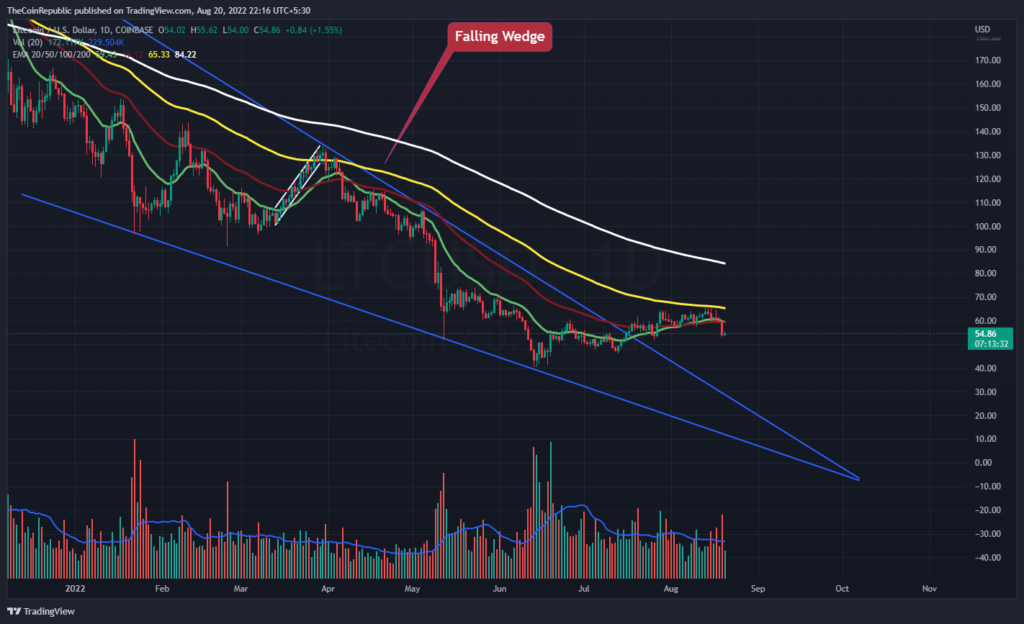
- Litecoin price is trying to recover back above the falling wedge pattern over the daily price chart.
- LTC crypto is trading below the 20, 50, 100, and 200-day Daily Moving Average.
- The pair of LTC/BTC is at 0.002581 BTC with an intraday gain of 0.70%.
The price of Litecoin has been sliding into a falling wedge over the daily price chart. Bulls on LTC made an attempt to maintain their position at the pattern’s top trendline in order to exit the falling pattern. The token is once again going in the direction of the top trendline with steadily building momentum. This time, the bulls must assemble themselves in order to witness the breakout of the token. By trying to force LTC back towards the lower trendline, bears are also seeking to reverse the momentum of the token’s advance. Investors in LTC must wait until LTC bulls retain their position at the upper trendline’s edge for the token to breakout.

Litecoin’s market capitalization has dropped by 1.06% during the last 24 hours to $54.80 at the current CMP price. The volume of trades decreased by 24.08% during intraday trading. Bulls must advance since they have a small stockpile in order to keep the LTC coin’s price rising steadily. The market cap to volume ratio is 0.1176.

On the daily price chart, the price of LTC is attempting to reverse its downward trend. Bulls must raise their own accumulation, however, if they want LTC to soar, as their own accumulation is not up to par. For LTC to effectively exit the pattern, the volume shift, which is now below average, needs to get better.
What do Technical Indicators suggest about LTC?
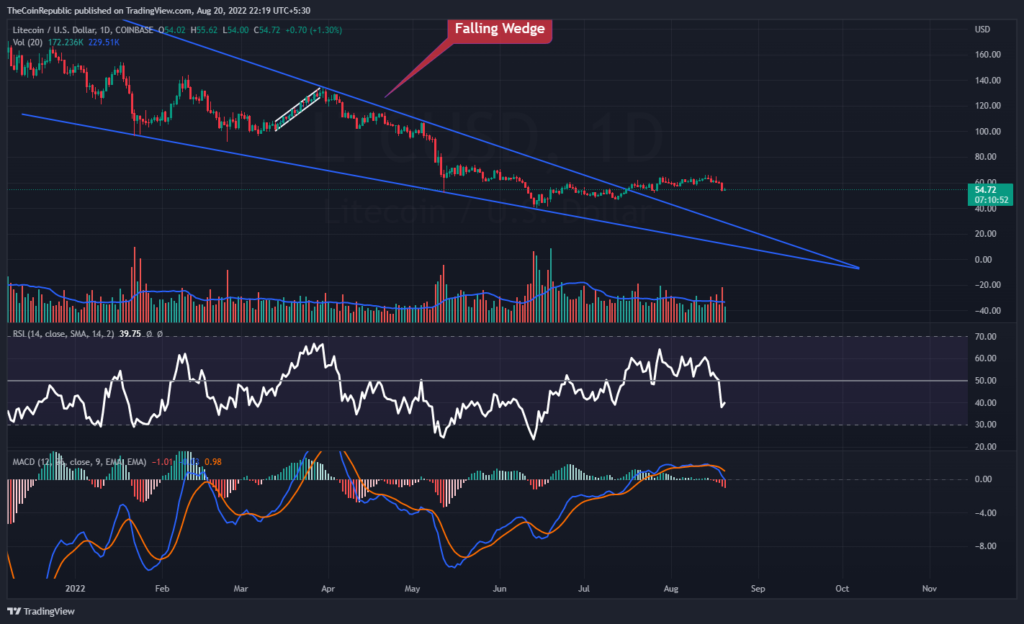
The LTC coin price is striving to ascend toward the upper trendline on the daily price chart. The token is trying to rebound inside the falling wedge. The coin has to develop bulls in order to end the falling pattern. Technical indications point to LTC’s downward trend momentum.
The Relative Strength Index highlights the positive momentum of the LTC coin. The RSI is heading towards neutrality at 39. The momentum of the LTC coin’s downturn can be seen on MACD. After a negative crossover, the MACD line is lower than the signal line. LTC investors need to keep an eye on the daily price chart for any changes in trends.
Conclusion
The price of Litecoin has been sliding into a falling wedge over the daily price chart. Bulls on LTC made an attempt to maintain their position at the pattern’s top trendline in order to exit the falling pattern. The token is once again going in the direction of the top trendline with steadily building momentum. This time, the bulls must assemble themselves in order to witness the breakout of the token. For LTC to effectively exit the pattern, the volume shift, which is now below average, needs to get better. Technical indications point to LTC’s downward trend momentum. LTC investors need to keep an eye on the daily price chart for any changes in trends.
Technical Levels
Support Levels: $50.00 and $47.00
Resistance Levels: $60.00 and $65.00
Disclaimer
The views and opinions stated by the author, or any people named in this article, are for informational ideas only, and they do not establish the financial, investment, or other advice. Investing in or trading crypto assets comes with a risk of financial loss.

Nancy J. Allen is a crypto enthusiast, with a major in macroeconomics and minor in business statistics. She believes that cryptocurrencies inspire people to be their own banks, and step aside from traditional monetary exchange systems. She is also intrigued by blockchain technology and its functioning. She frequently researches, and posts content on the top altcoins, their theoretical working principles and technical price predictions.


