
 Home
Home News
News
- Cosmos (ATOM) coin is trading at the first resistance level of 0.236-Fibonacci retracement.
- Price action forms an ascending parallel channel on the daily price scale.
- Buyers celebrated a 7-day high of a market cap of $3.64 billion last night.
The Cosmos (ATOM) has been outperforming for the past several weeks. The sales that started in April had turned the prospect of a sharp downtrend. But now the bulls reach the higher zone in terms of the daily price chart, thus, buyers accumulate coins in each minor drop.
Under the daily price scale, the price action is forming an ascending downward structure since the 2022 lows. Recently buyers saw minor retracement phase, later bulls appear bullish on ATOM coin. As a result, Cosmos Coin is seeing a rise of 19% so far this week, while the coin is trading at the $12.6 level at the time of this writing.
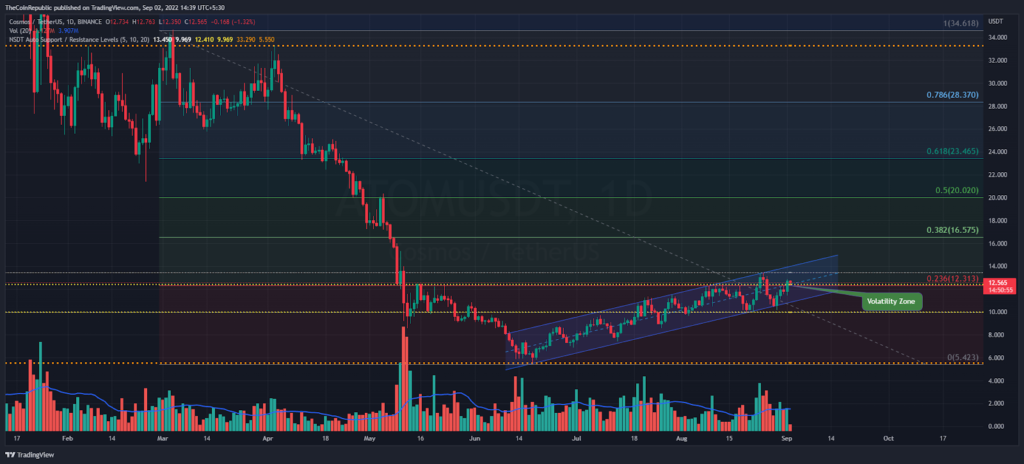
Cosmos Coin is trading at the first resistance level of 0.236-Fibonacci retracement on the daily price scale. The $12 mark has turned into an immediate support, besides, the 30-day high at $13.5 could act as resistance in the upcoming trading session.
Amidst the uptrend, buyers observed a 7-day high of the market cap at $3.64 billion, up 8% in the last 24 hours, according to CMC. However, the trading volume also increased sharply. Furthermore, the ATOM coin belonging to the bitcoin pair is up 7% at 0.0006281 satoshis.
Daily RSI Formed Double Bottom Near Semi-line
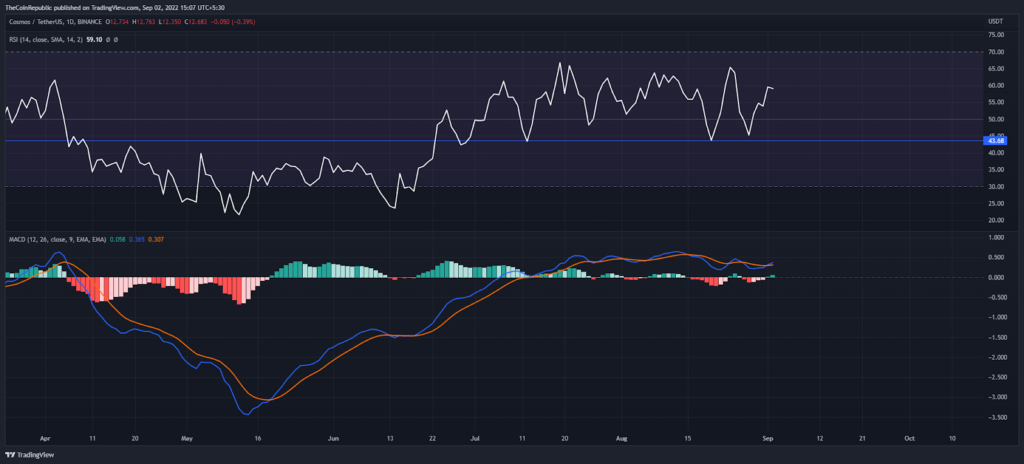
The daily RSI found support at 43-level, which gives buyers wings for more upside. The indicator shows a double bottom near the semi-line. Moreover, the MACD indicator appears to be flat in a positive zone on the daily price scale.
Conclusion
The Cosmos Coin (ATOM) is trading above an important moving average. The RSI indicator is showing positive signs as it is moving towards the overbought zone. Also the rising parallel channel is a major bullish factor for buyers.
Support levels – $10 and $8.0
Resistance levels – $13.5 and $20
Disclaimer
The views and opinions stated by the author, or any people named in this article, are for informational ideas only. They do not establish financial, investment, or other advice. Investing in or trading crypto assets comes with a risk of financial loss.

Andrew is a blockchain developer who developed his interest in cryptocurrencies while pursuing his post-graduation major in blockchain development. He is a keen observer of details and shares his passion for writing, along with coding. His backend knowledge about blockchain helps him give a unique perspective to his writing skills, and a reliable craft at explaining the concepts such as blockchain programming, languages and token minting. He also frequently shares technical details and performance indicators of ICOs and IDOs.


