
 Home
Home News
News
- The Tron (TRX) coin reverses the moving direction after crossing the horizontal range.
- Buyers turned aggressive near the lower band of the Bollinger Bands indicator.
- The daily RSI indicator is showing a no-trading zone for TRX coin.
Tron Coin (TRX) has been causing volatility for speculators in the recent pump and dump. TRX coin has consolidated within a range-boundary range between the $0.062 to $0.070 zone support and resistance over the past 60 days. At the time of writing, the altcoin is trading at the $0.0627 mark against USDT.
This wide horizontal range has caused many new traders to lose their money over the past few weeks. Later, the bears successfully broke the horizontal range on August 26, 2022 with massive trading volume. But there was heavy buying pressure against the bulls at the $0.060-support level, which trapped the bulls.
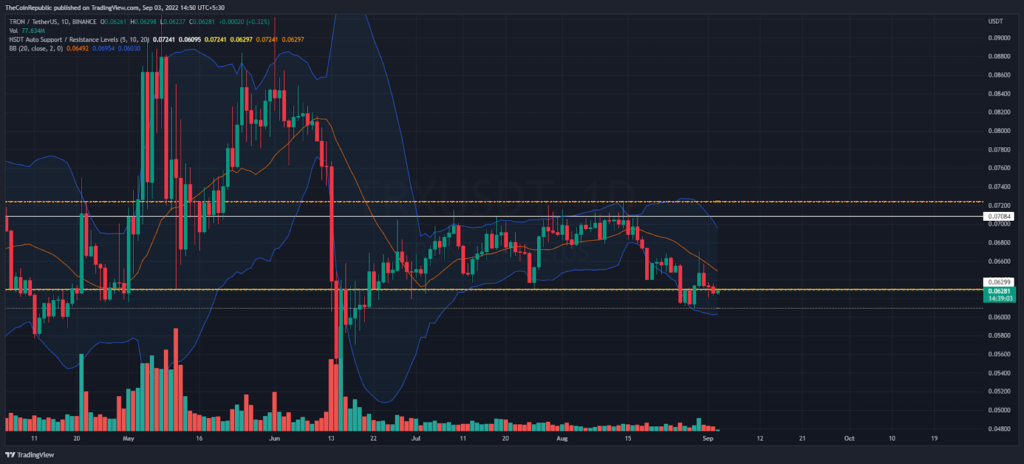
Amidst the price correction, TRX coin moved higher and received higher price rejection at the midline (20-day moving average) of the Bollinger Bands indicator. In the context of the daily price scale, the lower lever stands as a pumping area for the bulls.
The market cap is neutral at $5.79 billion as per CMC data for the last 24 hours. Meanwhile, the price of Tron coin pairing with the bitcoin pair is up a little over 1% at 0.00000317 satoshis. Furthermore, the neutral trading volume of $333 million suggests that speculators are not trading aggressively in TRX.
TRX Again Trades Into Horizontal Range
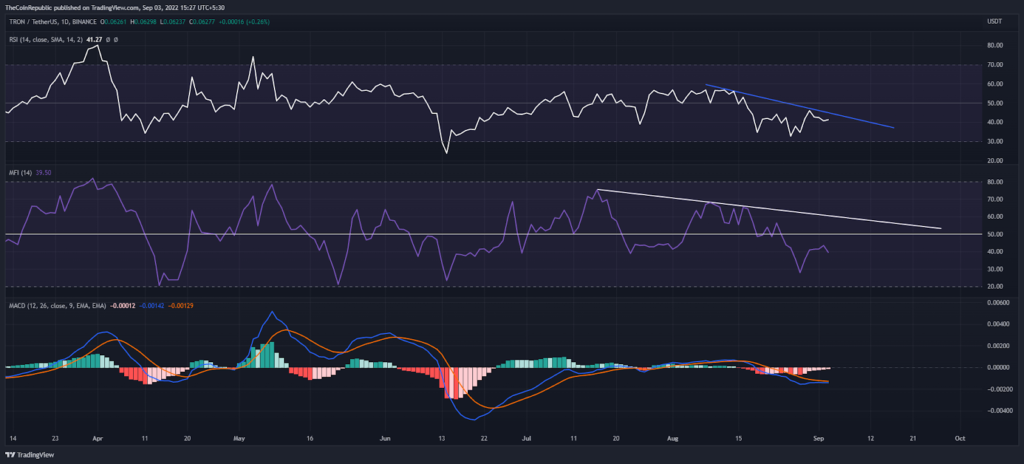
The daily RSI indicator is remaining sideways below the semi-line and below the declining trend line (blue). Similarly, the Money Flow Index started moving below the 40 level. Besides, the MACD continues to move downwards in the negative zone in terms of the daily price scale.
conclusion
Tron coin (TRX) looks sideways on the support trendline amid the decline. The lower range of the Bollinger Bands indicator is the last hope for a trend reversal for TRX investors. Furthermore, the RSI indicator and MACD suggest downside in the altcoin price.
Disclaimer
The views and opinions stated by the author, or any people named in this article, are for informational ideas only, and they do not establish the financial, investment, or other advice. Investing in or trading crypto assets comes with a risk of financial loss.

Nancy J. Allen is a crypto enthusiast, with a major in macroeconomics and minor in business statistics. She believes that cryptocurrencies inspire people to be their own banks, and step aside from traditional monetary exchange systems. She is also intrigued by blockchain technology and its functioning. She frequently researches, and posts content on the top altcoins, their theoretical working principles and technical price predictions.


