
 Home
Home News
News
- Synthetix price has fallen below a rising wedge pattern and is now consolidating over the daily price chart.
- SNX crypto has fallen below 20, 50, 100 and 200-days Daily Moving Average.
- The pair of SNX/BTC is at 0.0001479 BTC with an intraday drop of 1.61%.
Over the daily price chart, the Synthetix price is moving downwards approaching the lower trendline of the consolidation phase. To advance into its recovery phase, the token must keep the rising wedge pattern in place. Within the secure pattern, the token must maintain its recovery phase. Bears are attempting to capture the token in the grasp of short-sellers, nevertheless. For SNX cryptocurrency to remain within the rising wedge pattern, more buyers are needed. Investors in SNX must wait until the cryptocurrency begins to stabilize over the daily price chart.
The price of Synthetix, which is currently estimated at $2.93, has decreased 3.85% in the past day. The trading volume of the SNX currency has increased by 21.31% in one day. This shows a sharp fall in momentum for the SNX currency. Volume to market cap ratio is 0.1804.
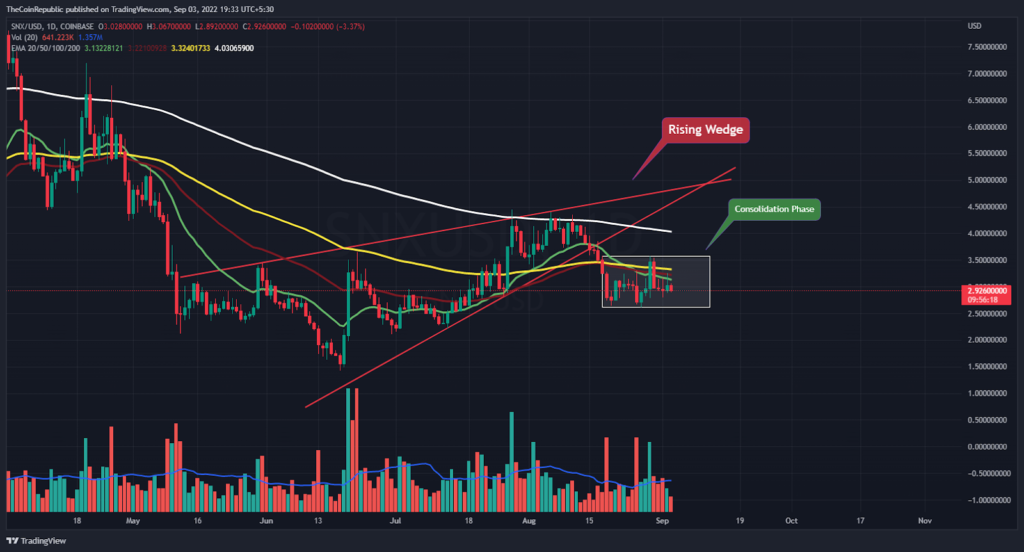
The price of the SNX coin is looking for support from buyers after falling below the consolidation phase’s accumulation threshold. The coin needs to gather support from buyers in order to alter the rising momentum and return to the upper level before the consolidation phase. However, it can be demonstrated that the volume change was below average and bear-influenced. Bulls on the SNX must gather before the token can move into its recovery phase.
Will SNX Recover Back from the Consolidation Phase?
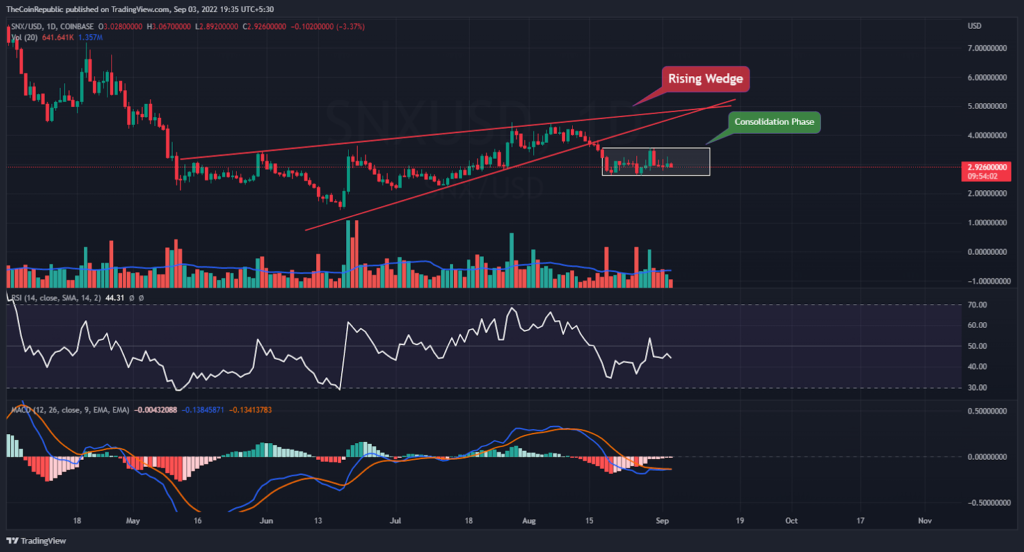
The price of the SNX cryptocurrency needs help from bulls to move past the lower trendline of the consolidation phase. The coin still has to attract a substantial number of buyers in order to overcome the daily chart. The strength of the SNX coin’s fall is shown by technical indicators.
The relative strength index shows the strength of the SNX cryptocurrency’s downturn. At 44, the RSI is approaching oversold territory. The SNX coin’s decline momentum is visible on MACD. After a negative crossover, the MACD line is lower than the signal line. Investors in SNX must watch the daily chart for any directional changes.
Conclusion
Over the daily price chart, the Synthetix price is moving downwards approaching the lower trendline of the consolidation phase. To advance into its recovery phase, the token must keep the rising wedge pattern in place. Within the secure pattern, the token must maintain its recovery phase. Bears are attempting to capture the token in the grasp of short-sellers, nevertheless. For SNX cryptocurrency to remain within the rising wedge pattern, more buyers are needed. However, it can be demonstrated that the volume change was below average and bear-influenced. Bulls on the SNX must gather before the token can move into its recovery phase. After a negative crossover, the MACD line is lower than the signal line. Investors in SNX must watch the daily chart for any directional changes.
Technical levels
Support Levels: $2.80 and $2.60
Resistance Levels: $3.25 and $3.55
Disclaimer
The views and opinions stated by the author, or any people named in this article, are for informational ideas only, and they do not establish the financial, investment, or other advice. Investing in or trading crypto assets comes with a risk of financial loss.
Steve Anderson is an Australian crypto enthusiast. He is a specialist in management and trading for over 5 years. Steve has worked as a crypto trader, he loves learning about decentralisation, understanding the true potential of the blockchain.


