
 Home
Home News
News

- IOTA price got stuck inside the descending triangle pattern over the daily price chart.
- MIOTA crypto has slipped below 20, 50, 100 and 200-days Daily Moving Average.
- The pair of MIOTA/BTC is at 0.00001321 BTC with an intraday drop of 1.10%.
The IOTA price has been declining through a descending triangle pattern over the daily price chart. The token has to break out of the downward trend on the daily price chart to prevent further collapse. A breakout from the descending triangle formation requires the price of MIOTA currency to hold where it is currently trading. Bears may, however, try to halt the upward trend and seek a reversal. Bulls must maintain their position at the current level since MIOTA is currently in a critical make-or-break scenario. Investors in MIOTA must wait until the token exits its falling trend and bulls hold onto their positions.

IOTA is presently valued at $0.266 and has lost 1.22% of its market value in the last day. However, trading volume fell by 12.05% during the intraday trading session. This demonstrates that bears are trying to pull back in order to allow IOTA to break out of the descending triangle pattern. Volume to market cap ratio is 0.02105.

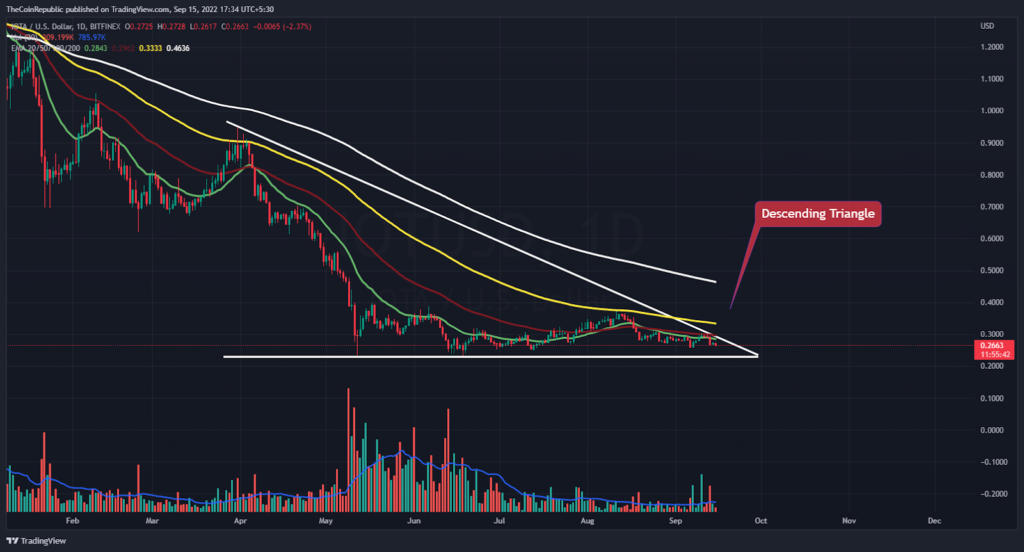
The price of the MIOTA currency must remain at this level in order to confirm its breakout from the descending triangle formation over the daily price chart. Before the IOTA coin is pushed out of its downward trend, investors must wait for bulls to pile up. It is necessary to boost the volume change, which is currently below average. This forecast suggests that MIOTA bulls need to accumulate more of themselves in order to avoid sliding into any kind of bearish trap.
What do Technical Indicators suggest about IOTA?
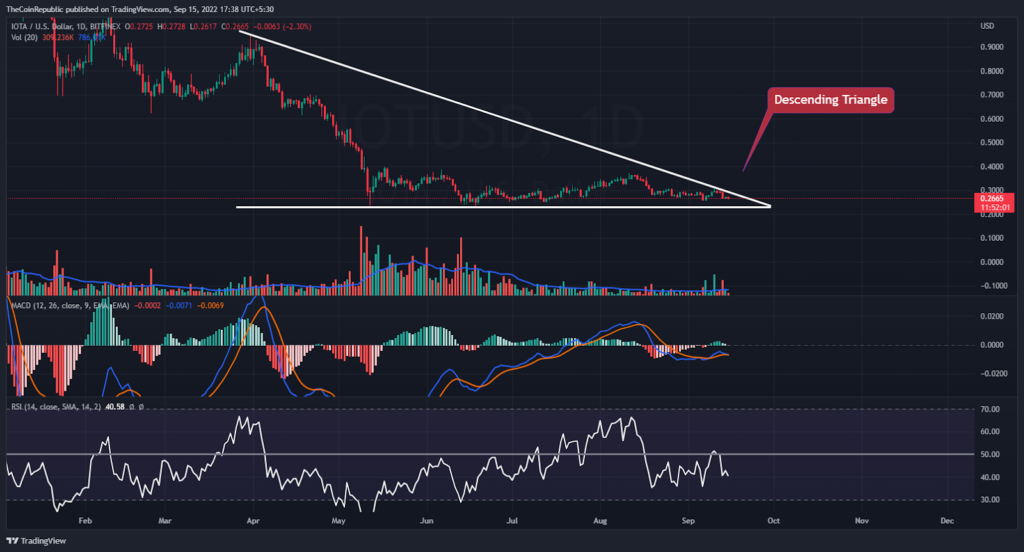
The price of MIOTA has been fluctuating inside a falling triangle trend since April 2022. On the daily price chart, the token originally saw a big loss, but as of right now, it is trading in the direction of its breakout and the start of its recovery phase. Technical indicators show that the downturn for the MIOTA currency is gaining momentum.
The relative strength index illustrates the magnitude of MIOTA’s decrease. At 40, the RSI is approaching oversold territory. On MACD, the MIOTA currency’s negative momentum is apparent. The MACD line and the signal line are about to cross negatively.
Conclusion
The IOTA price has been declining through a descending triangle pattern over the daily price chart. The token has to break out of the downward trend on the daily price chart to prevent further collapse. A breakout from the descending triangle formation requires the price of MIOTA currency to hold where it is currently trading. Bears may, however, try to halt the upward trend and seek a reversal. Bulls must maintain their position at the current level since MIOTA is currently in a critical make-or-break scenario. This forecast suggests that MIOTA bulls need to accumulate more of themselves in order to avoid sliding into any kind of bearish trap. Technical indicators show that the downturn for the MIOTA currency is gaining momentum. The MACD line and the signal line are about to cross negatively.
Technical Levels
Support Levels: $0.25 and $0.22
Resistance Levels: $0.30 and $0.35
Disclaimer
The views and opinions stated by the author, or any people named in this article, are for informational ideas only, and they do not establish the financial, investment, or other advice. Investing in or trading crypto assets comes with a risk of financial loss.

Nancy J. Allen is a crypto enthusiast, with a major in macroeconomics and minor in business statistics. She believes that cryptocurrencies inspire people to be their own banks, and step aside from traditional monetary exchange systems. She is also intrigued by blockchain technology and its functioning. She frequently researches, and posts content on the top altcoins, their theoretical working principles and technical price predictions.


