
 Home
Home News
News

- Stellar price has been consolidating inside the horizontal range-bound area over the daily price chart.
- XLM crypto is trading above 20 and 50 EMA but still behind 100 and 200-day Daily Moving averages.
- The pair of XLM/BTC is at 0.000005986 BTC with an intraday gain of 1.43%.
The Stellar’s price has been stable since June 11 and has been in a range-bound region. This existential crisis led to panic selling on the cryptocurrency market. Despite the extreme volatility of the bitcoin market, investors are trying to hang onto their own holdings. XLM is one of the digital currencies experiencing an existential crisis as it teeters at a record low. During this turbulent moment, cryptocurrency investors need to be as rock-solid as those with diamond hands. Diamond hands won’t be as eager to sell their holdings as other players.

XLM is presently trading at $0.114, representing a 0.22% gain in market value from yesterday. In the course of intraday trading, the trade volume climbed by 81.46%. This suggests that buyers are attempting to maintain a firm hold on the XLM coin. The volume to market cap ratio is 0.1075.

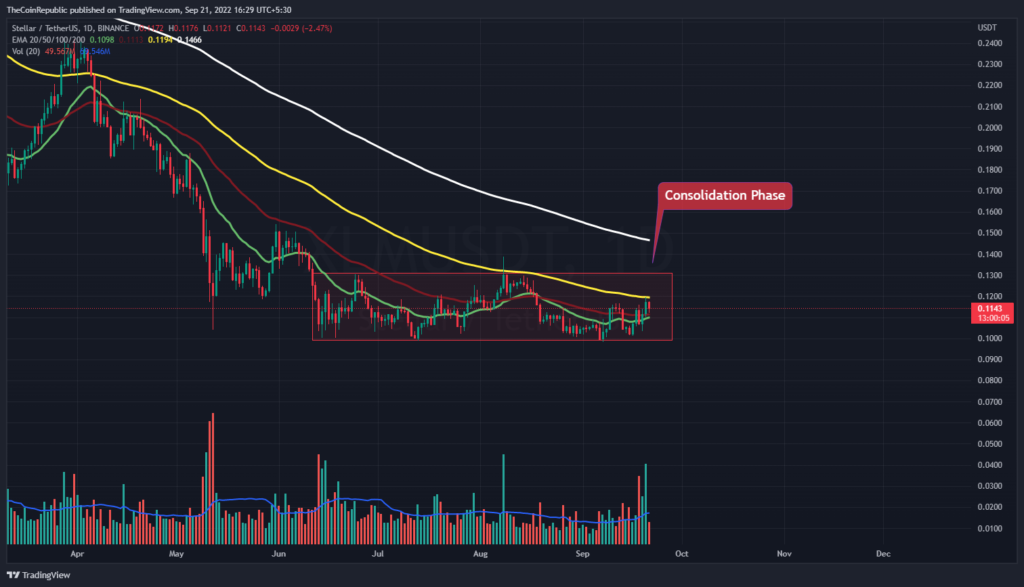
On the daily price chart, the price of the Stellar coin is clearly declining. Due to the market’s ongoing drop, the cryptocurrency asset has reverted to the consolidation phase close to the 2020 lows. If the price of the XLM currency is to increase back to the upper price range of the consolidation period, more buyers must enter the market. The cost of XLM has stayed constant between $0.100 and $0.130. The volume change, which is now modest in contrast to the norm, must increase for the XLM currency to cross the daily chart.
What do Technical Indicators suggest about XLM?
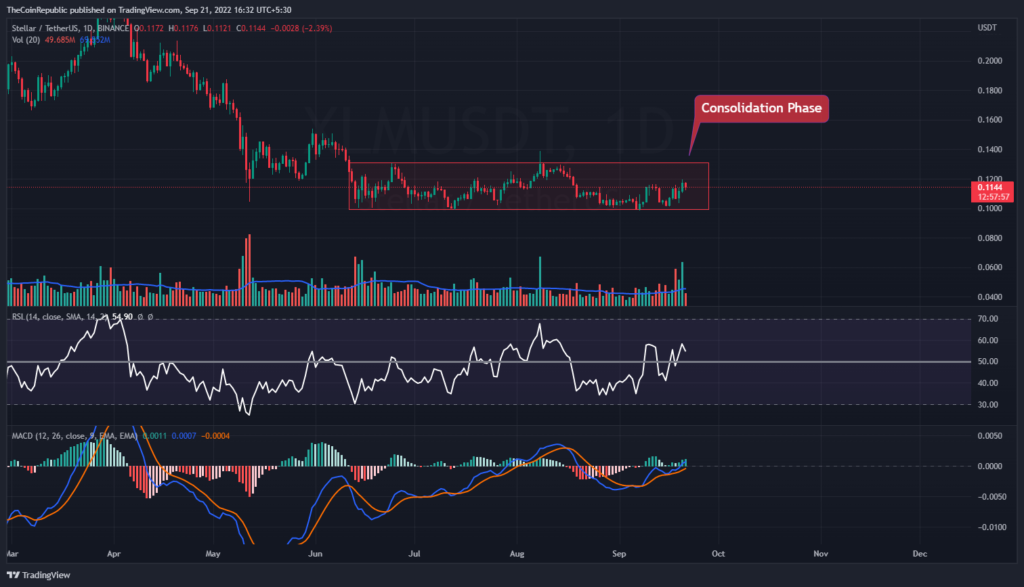
On the daily price chart, the price of XLM is increasing. For the XLM coin to quickly advance toward the peak price range of the consolidation phase, it has to attract more buyers. The strength of the negative trend for the XLM coin is indicated by technical indicators.
The value of the XLM coin has decreased, as indicated by the relative strength indicator (RSI). The neutrality of the RSI at 54 is soon to be broken. The XLM cryptocurrency’s MACD displays a bearish momentum. After a positive crossover, the MACD line is higher than the signal line. Investors in XLM should monitor the daily chart for any shifts in trends.
Conclusion
The Stellar’s price has been stable since June 11 and has been in a range-bound region. This existential crisis led to panic selling on the cryptocurrency market. Despite the extreme volatility of the bitcoin market, investors are trying to hang onto their own holdings. XLM is one of the digital currencies experiencing an existential crisis as it teeters at a record low. During this turbulent moment, cryptocurrency investors need to be as rock-solid as those with diamond hands. The cost of XLM has stayed constant between $0.100 and $0.130. The volume change, which is now modest in contrast to the norm, must increase for the XLM currency to cross the daily chart. The strength of the negative trend for the XLM coin is indicated by technical indicators. Investors in XLM should monitor the daily chart for any shifts in trends.
Technical Levels
Support Level: $0.1107 and $0.100
Resistance Level: $0.120 and $0.130
Disclaimer
The views and opinions stated by the author, or any people named in this article, are for informational ideas only, and they do not establish any financial, investment, or other advice. Investing in or trading crypto assets comes with a risk of financial loss.

Nancy J. Allen is a crypto enthusiast, with a major in macroeconomics and minor in business statistics. She believes that cryptocurrencies inspire people to be their own banks, and step aside from traditional monetary exchange systems. She is also intrigued by blockchain technology and its functioning. She frequently researches, and posts content on the top altcoins, their theoretical working principles and technical price predictions.


