
 Home
Home News
News
- Theta Network price has been consolidating inside the horizontal range-bound area over the daily price chart.
- THETA crypto is trading at 20 EMA but still below 50, 100, and 200-days Daily Moving Average.
- The pair of THETA/BTC is at 0.00005988 BTC with an intraday gain of 5.85%.
Over the daily price chart, the Theta Network price is attempting to break out of the consolidation phase. The coin needs to gather a sizable number of buyers in order to register its breakout. However, over the past 24 hours, THETA has gained over 4.58% of its market capitalization. For the token to adopt the consistent uptrend momentum and advance toward the upper trendline of the consolidation phase, THETA bull accumulation is necessary. The THETA coin price is attempting to establish a strong uptrend on the daily chart. The THETA bulls appear to be particularly intent on exiting the consolidation phase with a breach. Investors in THETA must wait until bulls maintain their position at the edge of the range-bound zone and breakthrough.

Theta Network is currently trading at CMP $1.138, up 4.58% in terms of market value from yesterday. During the intraday trading session, the trade volume jumped by almost 18%. The volume is upbeat, and the THETA currency appears to be recovering. THETA bulls need to keep up their present rate of ascent in order to see the THETA token breakout. The volume to market cap ratio is 0.04733.

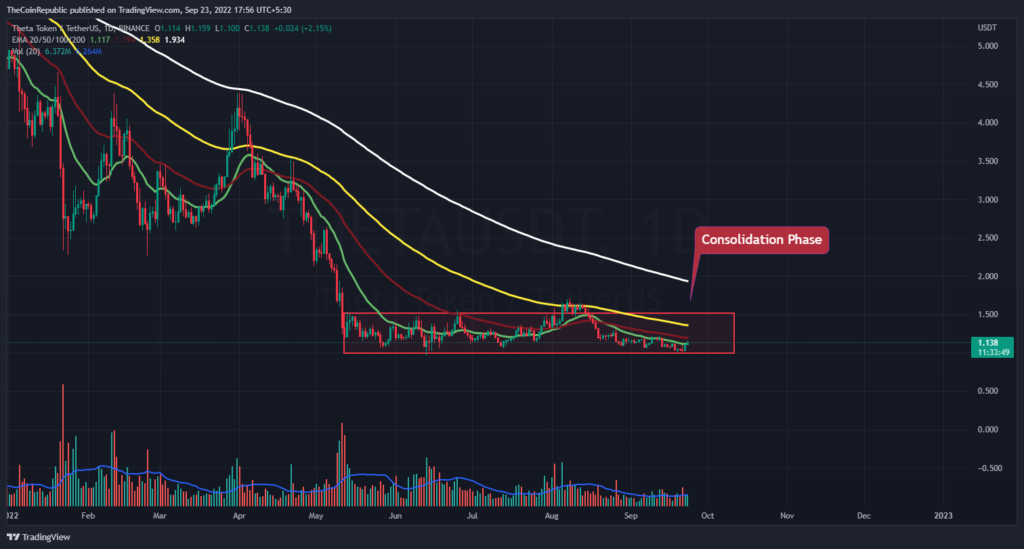
The price of THETA coins is moving quickly upward, as seen on the daily chart. After trading sideways since May 17, the token is attempting to break out of the consolidation phase. In order for THETA to properly break out of the pattern, bulls are working to build support. The transaction volume, which is below normal and needs to increase throughout the intraday trading session, can be used to identify this preventive moment. Bulls must maintain the upward momentum on THETA in order to maintain their position at the higher trendline.
What do Technical Indicators suggest about THETA?
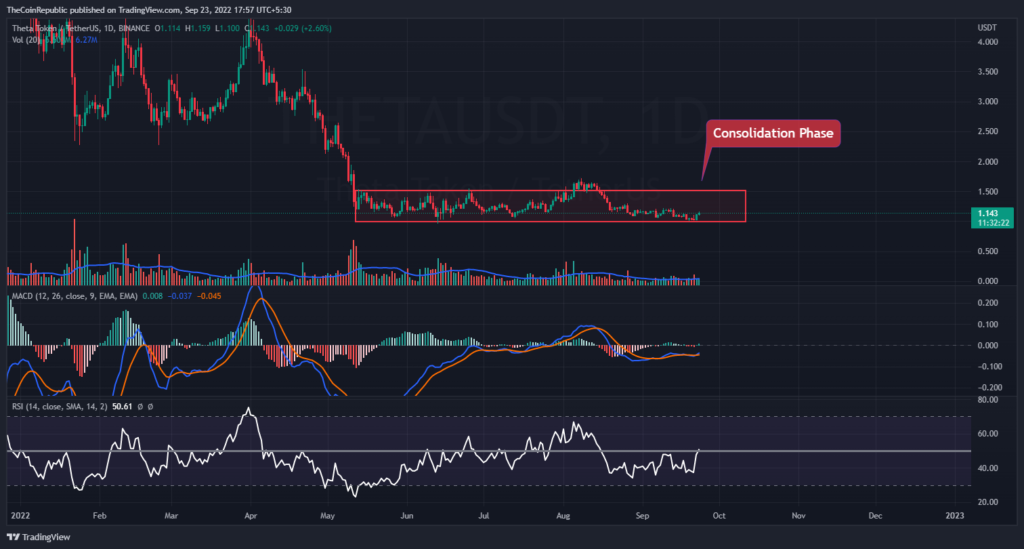
The THETA coin price is attempting to break through the daily price chart’s horizontal range-bound region. The coin is being pushed upward by THETA bulls, indicating its breakout. The current phase of consolidation appears to be coming to a conclusion for THETA. Technical indicators point to THETA’s daily chart showing an uptrend momentum.
The upward momentum of THETA toward the higher trendline is shown by the relative strength index. Investors in THETA can anticipate any directional change up to 50 once the RSI breaks out of neutrality at its current level of 37. The THETA coin’s lateral momentum is visible on the MACD during the consolidation phase. The MACD line is positioned such that it crosses the signal line and is awaiting any kind of crossing. Investors in THETA must watch the daily chart for any directional changes.
Conclusion
Over the daily price chart, the Theta Network price is attempting to break out of the consolidation phase. The coin needs to gather a sizable number of buyers in order to register its breakout. However, over the past 24 hours, THETA has gained over 4.58% of its market capitalization. For the token to adopt the consistent uptrend momentum and advance toward the upper trendline of the consolidation phase, THETA bull accumulation is necessary. The THETA coin price is attempting to establish a strong uptrend on the daily chart. The transaction volume, which is below normal and needs to increase throughout the intraday trading session, can be used to identify this preventive moment. Bulls must maintain the upward momentum on THETA in order to maintain their position at the higher trendline. The MACD line is positioned such that it crosses the signal line and is awaiting any kind of crossing. Investors in THETA must watch the daily chart for any directional changes.
Technical Levels
Support Level: $1.00
Resistance Level: $1.25
Disclaimer
The views and opinions stated by the author, or any people named in this article, are for informational ideas only, and they do not establish the financial, investment, or other advice. Investing in or trading crypto assets comes with a risk of financial loss.

Andrew is a blockchain developer who developed his interest in cryptocurrencies while pursuing his post-graduation major in blockchain development. He is a keen observer of details and shares his passion for writing, along with coding. His backend knowledge about blockchain helps him give a unique perspective to his writing skills, and a reliable craft at explaining the concepts such as blockchain programming, languages and token minting. He also frequently shares technical details and performance indicators of ICOs and IDOs.


