
 Home
Home News
News
- Bitcoin Cash price has been caged inside the horizontal range-bound area over the daily price chart.
- BCH crypto is trading at 20 EMA but still below 50, 100 and 200-days Daily Moving Average.
- The pair of BCH/BTC is at 0.006045 BTC with an intraday gain of 0.19%.
Since Bitcoin, the market’s main dominator, has once again fallen below the psychological threshold of $20,000 and is currently wobbling at $18,700, the entire cryptocurrency market is experiencing a challenging time. The price of Bitcoin Cash, which has dropped to $112 and is currently stalling at the lower trendline of the consolidation phase, is no different from other other cryptocurrencies that are experiencing the same destiny as Bitcoin (BTC). BCH coin needs to attract more buyers as it tries to hold at the consolidation phase’s lower trendline. The token must move forward and avoid short sellers’ grasp.

Currently valued at $118.05, Bitcoin Cash has increased its market capitalization by 0.15% over the past day. However, trading volume decreased by 3.35% during the intraday trading session. This demonstrates that sellers are motivated to drive down the price of BCH coin. Volume to market cap ratio is 0.07052.

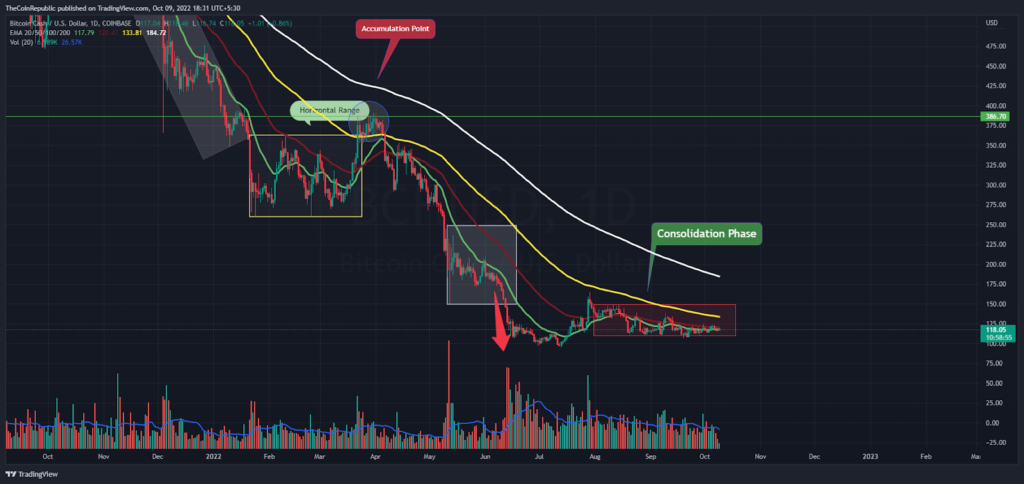
As the price of the BCH coin sinks to a lower level, bulls are hoping to hold at the present level in order to help the token rise back into the consolidation phase. However, the volume change is below average and has to be raised during the intraday trading period. In order to release the token from the grasp of short sellers, BCH bulls must come forward.
Technical Indicators Pointing Towards?
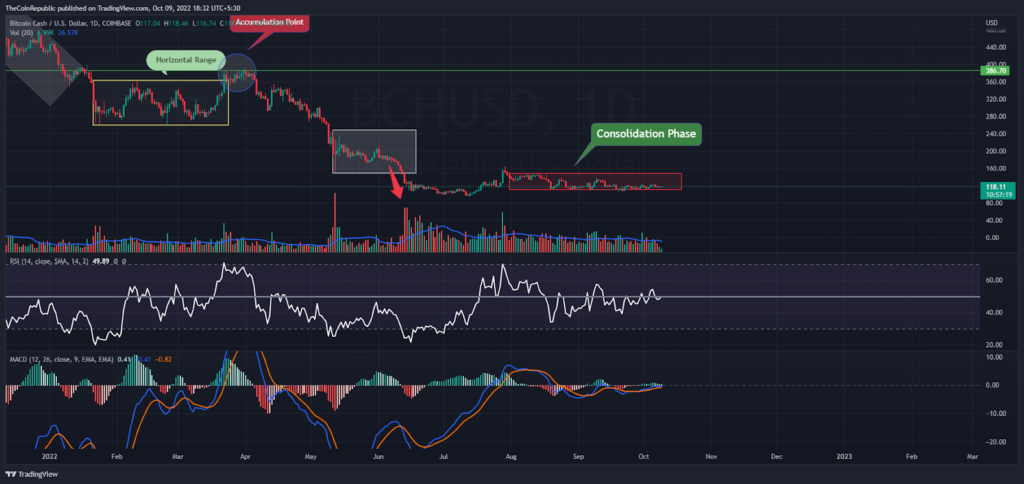
The BCH cryptocurrency is struggling to change the momentum, according to technical indicators. The BCH coin’s consolidation phase is highlighted by the Relative Strength Index, though. The RSI is currently flat at 49 and fights to stay below neutrality. On the MACD, the BCH coin is moving horizontally. The chart is about to show a shift in direction when the MACD line passes the signal line. BCH investors need to keep an eye on the daily price chart for any changes in trend.
Conclusion
Since Bitcoin, the market’s main dominator, has once again fallen below the psychological threshold of $20,000 and is currently wobbling at $18,700, the entire cryptocurrency market is experiencing a challenging time. The price of Bitcoin Cash, which has dropped to $112 and is currently stalling at the lower trendline of the consolidation phase, is no different from other other cryptocurrencies that are experiencing the same destiny as Bitcoin (BTC). In order to release the token from the grasp of short sellers, BCH bulls must come forward. Technical Indicators point to the BCH cryptocurrency’s struggle to change the momentum.
Technical Levels
Support Level: $115.00 and $110.00
Resistance Level: $125.00 and $150.00
Disclaimer
The views and opinions stated by the author, or any people named in this article, are for informational ideas only, and they do not establish the financial, investment, or other advice. Investing in or trading crypto assets comes with a risk of financial loss.

Nancy J. Allen is a crypto enthusiast, with a major in macroeconomics and minor in business statistics. She believes that cryptocurrencies inspire people to be their own banks, and step aside from traditional monetary exchange systems. She is also intrigued by blockchain technology and its functioning. She frequently researches, and posts content on the top altcoins, their theoretical working principles and technical price predictions.


