
 Home
Home News
News

- Bitcoin price prediction the ultimate vendetta of sellers on the move as BTC approaches the lower trendline.
- Bitcoin price has been dramatically maintaining itself above the $18500, the lowest level of the consolidation phase.
- Sellers crushed the hopes as they stole the show even buyers tried to resist the fall.
Bitcoin price prediction just caught up all of the cryptocurrency investors in the scarcity dilemma. BTC crypto must accumulate buyers as it approaches the lower trendline of the consolidation phase. Bears performing with full throttle ahead to pull down the giant cryptocurrency. Market dominance of BTC the dominator has crashed below 40% and is at 38% right now. BTC must avoid this short seller’s atrocity over the buyers and should look for a decent support zone to soar and roar with its market dominance beating all of the speculations regarding its existential crisis.

Bitcoin price is currently estimated at $19241 and has dropped by 1.32% in the market capitalization during the intraday trading session. Nevertheless, trading volume has increased by 44.77% in the intraday trading session. This demonstrates that buyers are trying to get involved in the trade to prevent BTC from falling below the $19000 mark. Volume to market cap ratio is 0.06598.

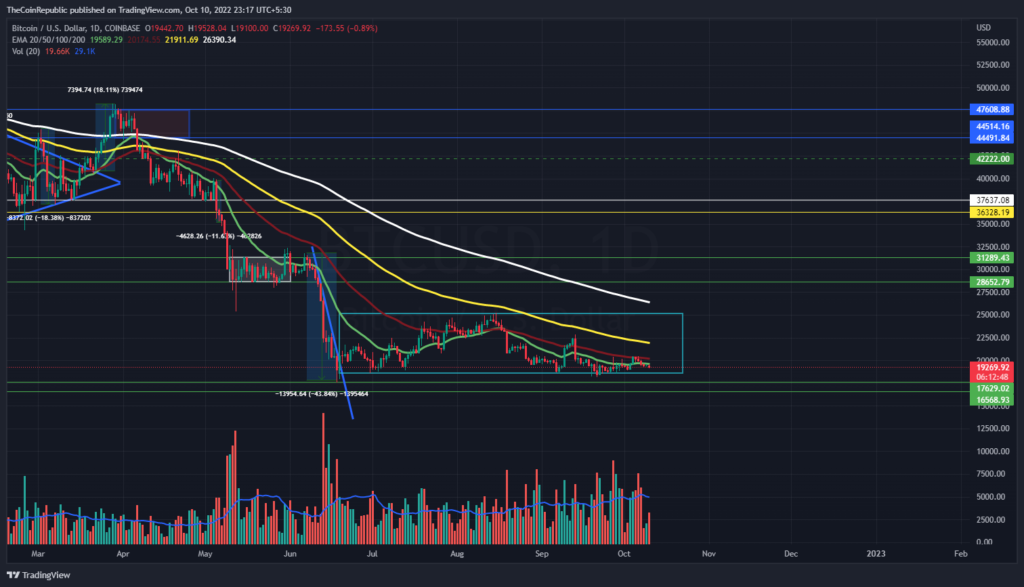
Bitcoin price prediction suggests that the greatest cryptocurrency may get support as soon as it reaches the $19000 level and even if it slump below that, then the only level which can provide the upthrust is the lower trendline of the consolidation phase. BTC price must attract more buyers in order to surge back towards the upper price range. Meanwhile, BTC price action has fallen below the 20, 50, 100 and 200-days Daily Moving Average. Volume bars can be seen below average and need to grow for BTC to be upright.
This Technical Indicator suggests the Downward Crossover!
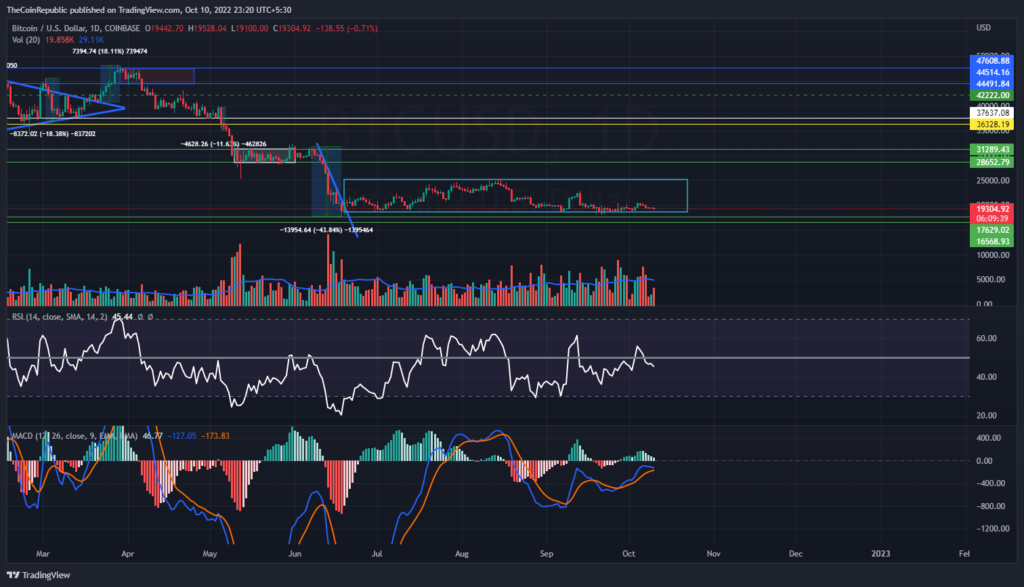
The technical indicators do suggest the downtrend momentum of BTC crypto. Relative strength index showcases the downtrend momentum of the crypto giant. RSI is at 45 and is trading towards the oversold territory. MACD exhibits the bearish momentum of Bitcoin. The MACD line is about to cross the signal line downwards for a negative crossover. BTC may see a slump as soon as the MACD line experiences a negative crossover.
Bitcoin investors must sit tight on the opportunity to be the right one and even on the right time to enter the market with some bullish instincts as BTC starts getting reversed from the $19000 or $18500.
Conclusion
Bitcoin price prediction just caught up all of the cryptocurrency investors in the scarcity dilemma. BTC crypto must accumulate buyers as it approaches the lower trendline of the consolidation phase. Bears performing with full throttle ahead to pull down the giant cryptocurrency. Volume bars can be seen below average and need to grow for BTC to be upright. The technical indicators do suggest the downtrend momentum of BTC crypto.
Technical Levels
Support Levels: $19000 and $18500
Resistance Levels: $20000 and $22300
Disclaimer
The views and opinions stated by the author, or any people named in this article, are for informational ideas only, and they do not establish the financial, investment, or other advice. Investing in or trading crypto assets comes with a risk of financial loss.

With a background in journalism, Ritika Sharma has worked with many reputed media firms focusing on general news such as politics and crime. She joined The Coin Republic as a reporter for crypto, and found a great passion for cryptocurrency, Web3, NFTs and other digital assets. She spends a lot of time researching and delving deeper into these concepts around the clock, and is a strong advocate for women in STEM.


