
 Home
Home News
News
- UPS Stock price managed to get support at $160 and is trying to surge towards the upper range of the horizontal range-bound area.
- The UPS Stock price managed to gain around 2.08% before the time of closing of the intraday trading session.
- The day’s range of the stock price is between $165.38 – $169.58 highs and lows respectively.
UPS Stock Price prediction has been consolidating inside the price range of $160 and $170 over the daily price chart. The asset needs to gain support and got support at 160 and is trying to surge towards the upper price range of the consolidation phase. The continuation in the price action suggests the smooth flow of stock during the previous trading sessions over the chart. Meanwhile, the price of UPS stock is trying to surpass the horizontal range-bound area in the intraday trading session. It’s a matter of time to see if the UPS stock price will be able to maintain the current bullish rally over the daily price chart.
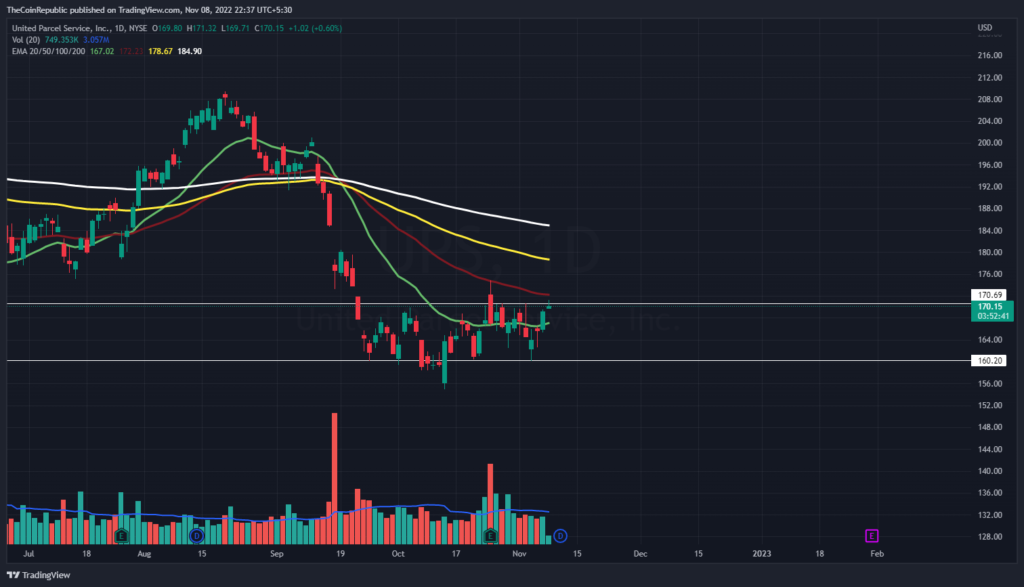
On the daily price chart, UPS Stock Price prediction has been consolidated between $160 and $170. The asset needed support and found it at 160. It is now attempting to soar toward the consolidation phase’s upper price range. The persistence of the price movement shows that the stock moved across the chart with ease during the previous trading sessions. However, the price of the stock is trying to sustain at the verge of the consolidation phase over the daily price chart. However, the token is still behind 50, 100 and 200-days Daily Moving Average. Meanwhile, volume change can be seen below average and needs to grow for UPS to grow in the intraday trading session.
What do Technical Indicators Point about UPS Stock?
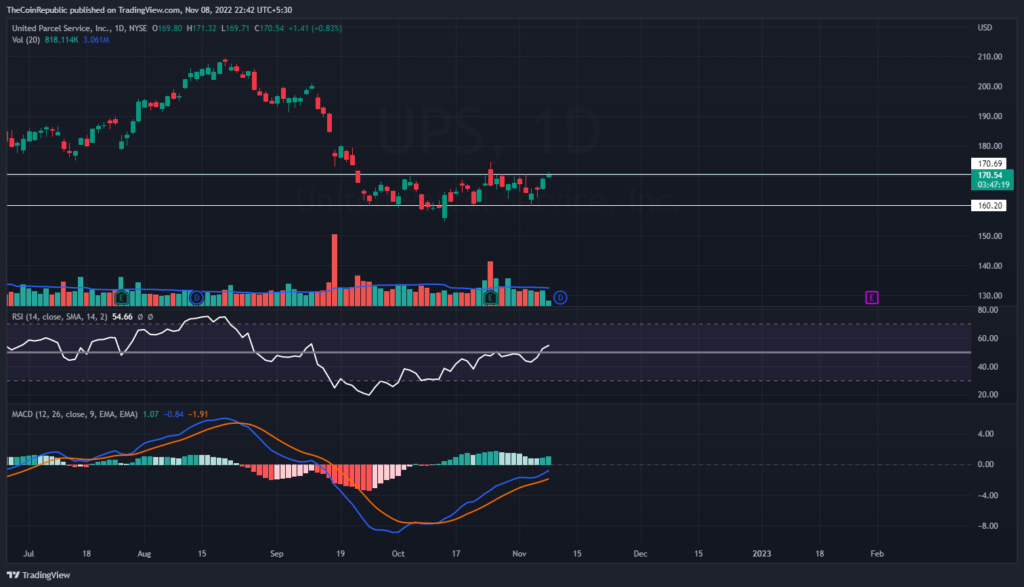
Technical indicators suggest the uptrend momentum of UPS Stock price over the daily chart. Relative Strength Index showcases the uptrend momentum of UPS Stock price. RSI is at 54 and is heading towards the overbought territory.
MACD exhibits the uptrend momentum of UPS price. The MACD line is ahead of the signal line after a positive crossover. UPS investors need to wait for any directional change during the intraday trading session.
Conclusion
UPS Stock Price has been consolidating inside the price range of $160 and $170 over the daily price chart. The asset needs to gain support and got support at 160 and is trying to surge towards the upper price range of the consolidation phase. However, the price of the stock is trying to sustain at the verge of the consolidation phase over the daily price chart. However, the token is still behind 50, 100 and 200-days Daily Moving Average. The MACD line is ahead of the signal line after a positive crossover. UPS investors need to wait for any directional change during the intraday trading session.
Technical Levels
Support Level: $165 and $160
Resistance Level $175 and $180
Disclaimer
The views and opinions stated by the author, or any people named in this article, are for informational ideas only, and they do not establish the financial, investment, or other advice. Investing in or trading crypto assets comes with a risk of financial loss.

Andrew is a blockchain developer who developed his interest in cryptocurrencies while pursuing his post-graduation major in blockchain development. He is a keen observer of details and shares his passion for writing, along with coding. His backend knowledge about blockchain helps him give a unique perspective to his writing skills, and a reliable craft at explaining the concepts such as blockchain programming, languages and token minting. He also frequently shares technical details and performance indicators of ICOs and IDOs.


