
 Home
Home News
News
- The unpredictable price of the ETC is making it difficult for investors
- The current price of ETC is approx $21.26 with a drop of 1.86% during the intraday trading session
- The pair of ETC/BTC is currently at 0.001249 BTC with the incline of 0.29% in the last 24 hours
The bears have fought really hard to bring the drastic fall which has given a defeat to the upward trend, and the Ethereum Classic is closely following the downward momentum. The ETC is moving downwards, and although the bulls will make every effort to surpass the bears’ plans, this time the bears have a decent strategy to take the ball in their court.
In this volatile market, Ethereum Classic is presently trading at roughly $21.26 and has climbed by around 1.86% during the intraday trading session. The currency is firmly heading towards the downward trend, and if the bulls do not get into the trade, the price may break through to the secondary support which may result in a loss in ETC’s potential. This may lead the price to break to primary support of $18.02 and if the bears dominate the market of the ETC then the price may reach secondary support of $13.74.The bulls must exert a lot of effort in order to put the initiative in their hands and influence the coin’s price. If the bulls are successful in their attempts, the price may cross over to the primary resistance level of $25.12 and then move up to the secondary resistance level of $26.56.
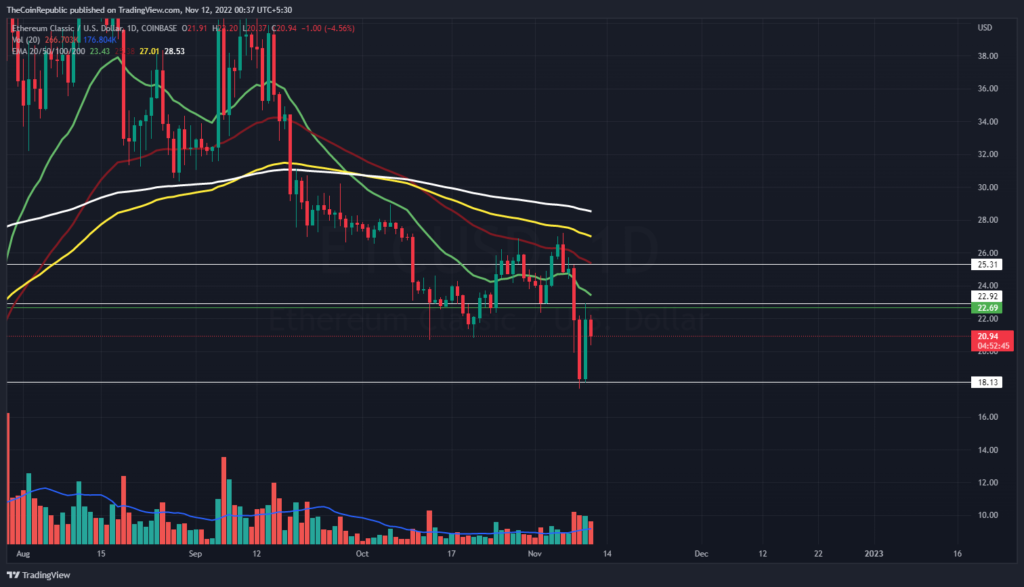
The coin’s volume has dropped by 47.72% over the past 24 hours, a continuous decrease in the volume indicates that the short-selling pressure is increasing. To bring hope to investors, the bulls must push themselves. As the bears want to crush the bulls, they will struggle to build a strong market for ETC and it will be more challenging for the bulls to achieve their goals.
What do Technical Indicators suggest about ETC?
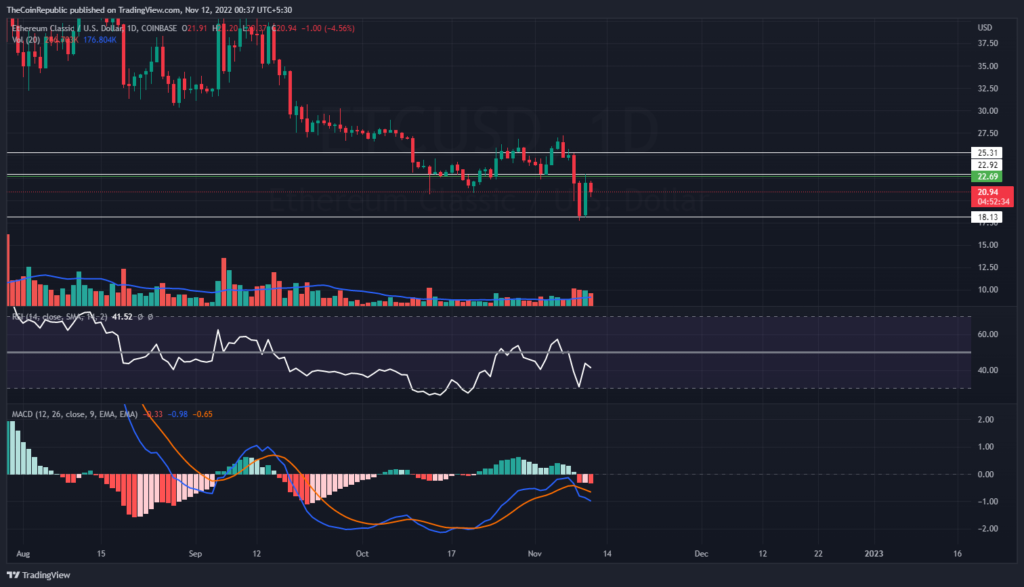
The technical indicator shows the following: The Relative Strength Index is approaching overbought territory. The current RSI is 41.65 which is above the average RSI of 60.30. The selling is increased to get the RSI to the oversold zone. The coin’s price is lagging the 20,50,100,200 Daily Moving Average.
The MACD and signal have intersected indicating the negative cross.
Conclusion
The bears have fought really hard to bring the drastic fall which has given a defeat to the upward trend, and the Ethereum Classic is closely following the downward momentum. This may lead the price to break to primary support of $18.02 and if the bears dominate the market of the ETC then the price may reach secondary support of $13.74. The current RSI is 41.65 which is above the average RSI of 60.30. The MACD and signal have intersected indicating the negative cross.
Technical Levels
Support Level: $18.00 and $17.00
Resistance Level $22.00 and $25.00
Disclaimer
The views and opinions stated by the author, or any people named in this article, are for informational ideas only, and they do not establish the financial, investment, or other advice. Investing in or trading crypto assets comes with a risk of financial loss.

Andrew is a blockchain developer who developed his interest in cryptocurrencies while pursuing his post-graduation major in blockchain development. He is a keen observer of details and shares his passion for writing, along with coding. His backend knowledge about blockchain helps him give a unique perspective to his writing skills, and a reliable craft at explaining the concepts such as blockchain programming, languages and token minting. He also frequently shares technical details and performance indicators of ICOs and IDOs.


