
 Home
Home News
News

- Bitcoin price prediction suggests the cryptocurrency giant’s consolidation phase at the lowest level over the daily price chart.
- BTC crypto has slipped below 20, 50, 100 and 200-days Daily Moving Average.
- Bitcoin the traditional cryptocurrency is finally trying to remain above $15000 as it rebounds from the $15500 and is preparing for its recovery.
Bitcoin price prediction suggests the token’s consolidation phase and its bloodbath at the lower level over the daily price chart. The cryptocurrency market has been going through some tough times as BTC slumps till $15500 and is finally looking for its recovery over the daily price chart. The price dump occurred as soon as the traditional cryptocurrency left the previous consolidation phase and faltered to gather support after falling below $18500. However, this time BTC looked pretty confident to register its recovery phase over the daily price chart.

Bitcoin price is currently approximated at $16449 and has gained 1.60% of its market capitalization in the last 24-hour period. However, trading volume has decreased by 11.27% during the intraday trading session. This indicates that BTC is still facing short selling pressure during the intraday trading session.

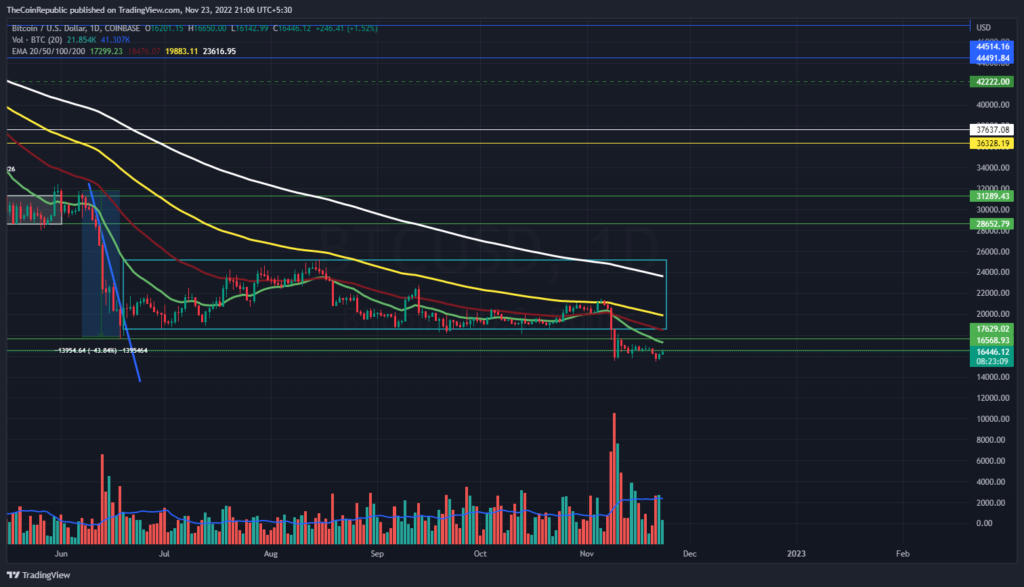
Bitcoin price prediction suggests the sideways momentum of the traditional cryptocurrency. BTC still needs to accumulate buyers in order to surge towards the recovery zone over the daily chart. However, volume change can be seen below average and needs to grow for BTC to recover itself. Meanwhile, BTC crypto has slipped below 20, 50, 100 and 200-days Daily Moving Average.
This Indicator is about to Experience a Positive Crossover!
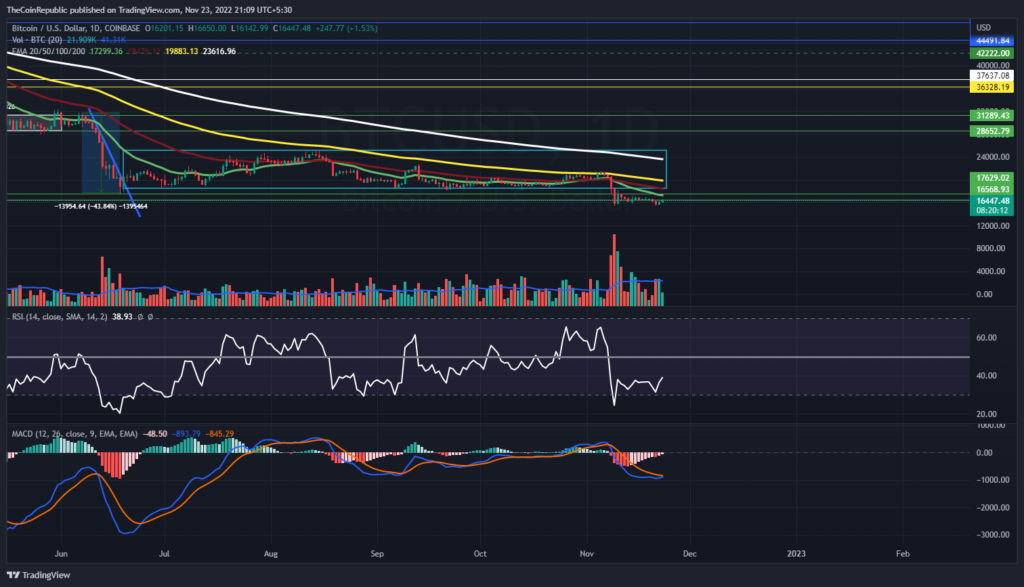
Technical indicators suggest the uptrend momentum of BTC crypto. Relative Strength Index showcases the uptrend momentum of BTC over the daily chart. RSI is at 38 and is heading towards neutrality. MACD exhibits the uptrend momentum of BTC. The MACD line is about to cross the signal line upwards, registering a positive crossover. BTC investors may witness a significant recovery as soon as MACD experiences a positive crossover.
Conclusion
Bitcoin price prediction suggests the token’s consolidation phase and its bloodbath at the lower level over the daily price chart. The cryptocurrency market has been going through some tough times as BTC slumps till $15500 and is finally looking for its recovery over the daily price chart. However, volume change can be seen below average and needs to grow for BTC to recover itself. Meanwhile, BTC crypto has slipped below 20, 50, 100 and 200-days Daily Moving Average. BTC investors may witness a significant recovery as soon as MACD experiences a positive crossover.
Technical Levels
Support Level: $15500 and $15300
Resistance Level $17000 and $17600
Disclaimer
The views and opinions stated by the author, or any people named in this article, are for informational ideas only, and they do not establish the financial, investment, or other advice. Investing in or trading crypto assets comes with a risk of financial loss.

With a background in journalism, Ritika Sharma has worked with many reputed media firms focusing on general news such as politics and crime. She joined The Coin Republic as a reporter for crypto, and found a great passion for cryptocurrency, Web3, NFTs and other digital assets. She spends a lot of time researching and delving deeper into these concepts around the clock, and is a strong advocate for women in STEM.


